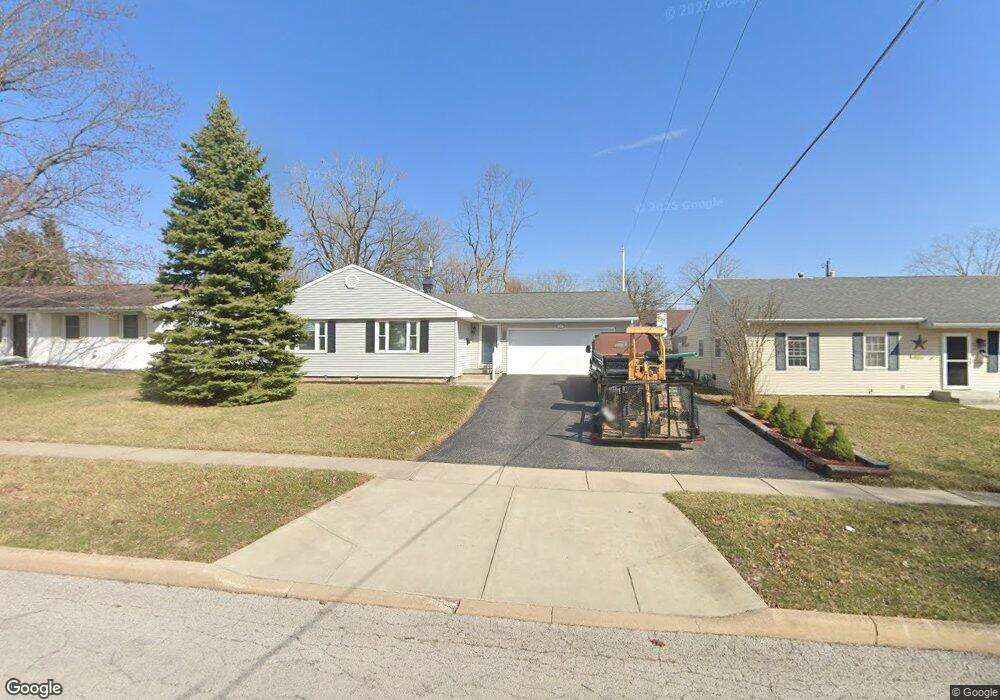
2009 Jennifer Ln Findlay, OH 45840
Estimated Value: $193,000 - $200,274
3
Beds
2
Baths
1,224
Sq Ft
$161/Sq Ft
Est. Value
About This Home
This home is located at 2009 Jennifer Ln, Findlay, OH 45840 and is currently estimated at $196,819, approximately $160 per square foot. 2009 Jennifer Ln is a home located in Hancock County with nearby schools including Whittier Primary School, Bigelow Hill Elementary School, and Glenwood Middle School.
Ownership History
Date
Name
Owned For
Owner Type
Purchase Details
Closed on
Jul 14, 2003
Sold by
Meisner Darrell H and Meisner Linda K
Bought by
Nuzum Greg D
Current Estimated Value
Home Financials for this Owner
Home Financials are based on the most recent Mortgage that was taken out on this home.
Original Mortgage
$82,800
Outstanding Balance
$35,494
Interest Rate
5.37%
Mortgage Type
Purchase Money Mortgage
Estimated Equity
$161,325
Purchase Details
Closed on
Jul 25, 1995
Sold by
Feraldo Louis
Bought by
Meisner Darrell
Home Financials for this Owner
Home Financials are based on the most recent Mortgage that was taken out on this home.
Original Mortgage
$76,000
Interest Rate
7.5%
Mortgage Type
New Conventional
Purchase Details
Closed on
Aug 27, 1993
Bought by
Feraldo Louis J and Feraldo Connie G
Purchase Details
Closed on
Aug 25, 1993
Bought by
Lepper Darren R
Purchase Details
Closed on
Jun 16, 1992
Bought by
Sherman Lucille M
Purchase Details
Closed on
Nov 13, 1987
Bought by
Cooper Daniel L and Cooper Cinthia
Create a Home Valuation Report for This Property
The Home Valuation Report is an in-depth analysis detailing your home's value as well as a comparison with similar homes in the area
Home Values in the Area
Average Home Value in this Area
Purchase History
| Date | Buyer | Sale Price | Title Company |
|---|---|---|---|
| Nuzum Greg D | $92,000 | -- | |
| Meisner Darrell | $81,000 | -- | |
| Feraldo Louis J | $76,000 | -- | |
| Lepper Darren R | -- | -- | |
| Sherman Lucille M | $72,000 | -- | |
| Cooper Daniel L | $53,000 | -- |
Source: Public Records
Mortgage History
| Date | Status | Borrower | Loan Amount |
|---|---|---|---|
| Open | Nuzum Greg D | $82,800 | |
| Previous Owner | Meisner Darrell | $76,000 |
Source: Public Records
Tax History Compared to Growth
Tax History
| Year | Tax Paid | Tax Assessment Tax Assessment Total Assessment is a certain percentage of the fair market value that is determined by local assessors to be the total taxable value of land and additions on the property. | Land | Improvement |
|---|---|---|---|---|
| 2024 | $1,718 | $48,370 | $7,030 | $41,340 |
| 2023 | $1,721 | $48,370 | $7,030 | $41,340 |
| 2022 | $1,715 | $48,370 | $7,030 | $41,340 |
| 2021 | $1,666 | $40,930 | $7,040 | $33,890 |
| 2020 | $1,666 | $40,930 | $7,040 | $33,890 |
| 2019 | $1,632 | $40,930 | $7,040 | $33,890 |
| 2018 | $1,547 | $35,590 | $6,120 | $29,470 |
| 2017 | $774 | $35,590 | $6,120 | $29,470 |
| 2016 | $1,531 | $35,590 | $6,120 | $29,470 |
| 2015 | $1,432 | $32,750 | $6,120 | $26,630 |
| 2014 | $1,432 | $32,750 | $6,120 | $26,630 |
| 2012 | $1,618 | $36,730 | $6,120 | $30,610 |
Source: Public Records
Map
Nearby Homes
- 1908 Gayle Ln
- 600 Charles Ave
- 0 E Melrose Ave
- 0 Sheridan Ave
- 715 Christina Ct
- 1865 Breckenridge Rd
- 1062 Vincent St
- 1736 Woodridge Crescent
- 1010 Brenda Ct
- 1928 Deer Ridge Dr
- 1928 Deer Ridge Dr Unit L-133
- 2100 Candlewick Dr
- 334 E Foulke Ave
- 420 Allen Ave
- 1825 Pershing St
- 1216 Concord Ct
- 231 Tioga Ave
- 1474 Southwood Ave
- 716 Winfield Ave
- 230 Midland Ave
- 2013 Jennifer Ln
- 2005 Jennifer Ln
- 2017 Jennifer Ln
- 2001 Jennifer Ln
- 2008 W Hill Trail
- 2012 Hill Tr
- 2012 W Hill Trail
- 2004 W Hill Trail
- 2016 W Hill Trail
- 2021 Jennifer Ln
- 2008 Jennifer Ln
- 1927 Jennifer Ln
- 2000 W Hill Trail
- 2000 Hill Tr
- 2004 Jennifer Ln
- 2012 Jennifer Ln
- 2000 Jennifer Ln
- 2025 Jennifer Ln
- 1908 W Hill Trail
- 1923 Jennifer Ln