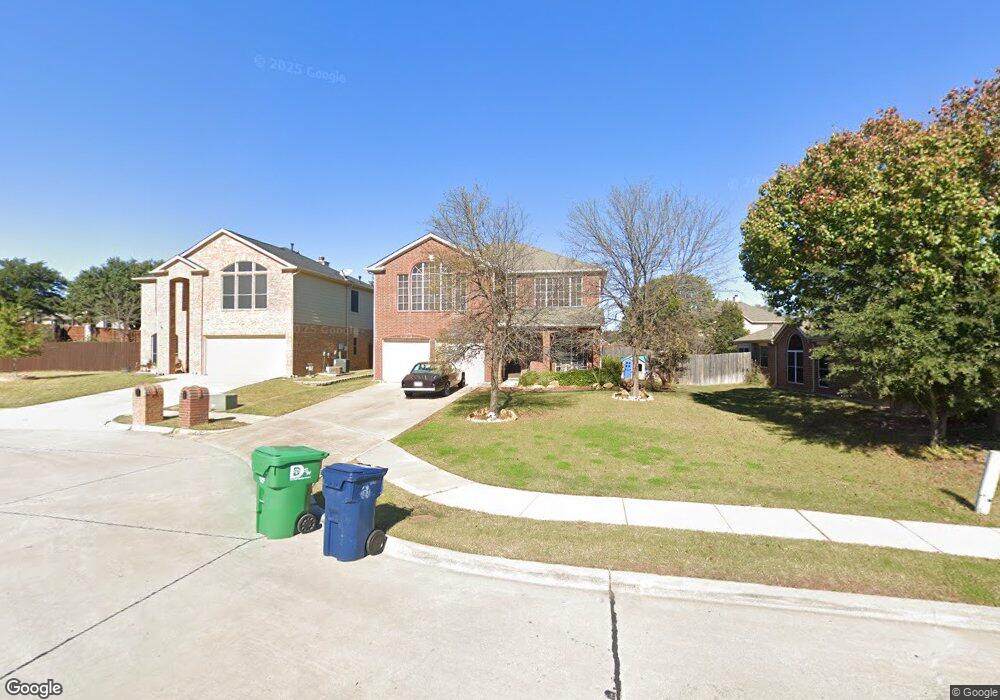
2009 Lamprey Cir Denton, TX 76210
South Denton NeighborhoodEstimated Value: $373,000 - $403,000
3
Beds
3
Baths
2,178
Sq Ft
$176/Sq Ft
Est. Value
About This Home
This home is located at 2009 Lamprey Cir, Denton, TX 76210 and is currently estimated at $382,561, approximately $175 per square foot. 2009 Lamprey Cir is a home located in Denton County with nearby schools including Houston Elementary School, McMath Middle School, and Denton High School.
Ownership History
Date
Name
Owned For
Owner Type
Purchase Details
Closed on
Feb 26, 2010
Sold by
King Daniel Blair and King Lisa Lynn
Bought by
Buresh Dale J and Buresh Krista S
Current Estimated Value
Home Financials for this Owner
Home Financials are based on the most recent Mortgage that was taken out on this home.
Original Mortgage
$157,102
Outstanding Balance
$106,793
Interest Rate
5.5%
Mortgage Type
FHA
Estimated Equity
$275,768
Purchase Details
Closed on
May 31, 2001
Sold by
Herring Jimmie and Herring Beth R
Bought by
King Daniel Blair and King Lisa Lynn
Home Financials for this Owner
Home Financials are based on the most recent Mortgage that was taken out on this home.
Original Mortgage
$143,863
Interest Rate
7.1%
Mortgage Type
FHA
Purchase Details
Closed on
Jun 2, 1999
Sold by
Pulte Homes Of Texas Lp
Bought by
Herring Jimmie and Herring Beth R
Home Financials for this Owner
Home Financials are based on the most recent Mortgage that was taken out on this home.
Original Mortgage
$136,050
Interest Rate
6.91%
Create a Home Valuation Report for This Property
The Home Valuation Report is an in-depth analysis detailing your home's value as well as a comparison with similar homes in the area
Home Values in the Area
Average Home Value in this Area
Purchase History
| Date | Buyer | Sale Price | Title Company |
|---|---|---|---|
| Buresh Dale J | -- | Fatco | |
| King Daniel Blair | -- | -- | |
| Herring Jimmie | -- | -- |
Source: Public Records
Mortgage History
| Date | Status | Borrower | Loan Amount |
|---|---|---|---|
| Open | Buresh Dale J | $157,102 | |
| Previous Owner | King Daniel Blair | $143,863 | |
| Previous Owner | Herring Jimmie | $136,050 |
Source: Public Records
Tax History Compared to Growth
Tax History
| Year | Tax Paid | Tax Assessment Tax Assessment Total Assessment is a certain percentage of the fair market value that is determined by local assessors to be the total taxable value of land and additions on the property. | Land | Improvement |
|---|---|---|---|---|
| 2025 | $5,244 | $365,319 | $70,972 | $294,347 |
| 2024 | $6,439 | $333,599 | $0 | $0 |
| 2023 | $4,594 | $303,272 | $70,972 | $295,015 |
| 2022 | $5,853 | $275,702 | $70,972 | $237,309 |
| 2021 | $5,572 | $250,638 | $55,543 | $195,095 |
| 2020 | $5,442 | $238,071 | $55,543 | $182,528 |
| 2019 | $5,415 | $226,936 | $55,543 | $175,427 |
| 2018 | $4,984 | $206,305 | $55,543 | $166,179 |
| 2017 | $4,636 | $187,550 | $55,543 | $148,023 |
| 2016 | $4,114 | $170,500 | $37,029 | $153,605 |
| 2015 | $3,613 | $155,000 | $37,029 | $117,971 |
| 2013 | -- | $158,761 | $37,029 | $121,732 |
Source: Public Records
Map
Nearby Homes
- 2009 Lake Fork Ct
- 2000 Lamprey Cir
- 2209 Loon Lake Rd
- 2312 Caddo Cir
- 2409 Loon Lake Rd
- 720 Smokerise Cir
- 3432 Sundown Blvd
- 2505 Pioneer Dr
- 1108 Ellison Park Cir
- 2508 Pioneer Dr
- 2501 Great Bear Ln
- 2600 Pioneer Dr
- 916 Smokerise Cir
- 2544 Natchez Trace
- 1012 Indian Ridge Dr
- 2272 Hollyhill Ln
- 2253 Hollyhill Ln
- 2601 Pinto Dr
- 2713 Clubhouse Dr
- 2008 Moonsail Ln
- 2013 Lamprey Cir
- 2005 Lamprey Cir
- 2017 Lamprey Cir
- 2001 Lamprey Cir
- 2008 Lake Fork Cir
- 2008 Lamprey Cir
- 2021 Lamprey Cir
- 2012 Lamprey Cir
- 2004 Lake Fork Cir
- 2012 Lake Fork Cir
- 2004 Lamprey Cir
- 2016 Lamprey Cir
- 2101 Lamprey Cir
- 2020 Lamprey Cir
- 2000 Lake Fork Cir
- 2005 Loon Lake Rd
- 2100 Huron Cir
- 2009 Loon Lake Rd
- 2100 Lamprey Cir
- 2105 Lamprey Cir