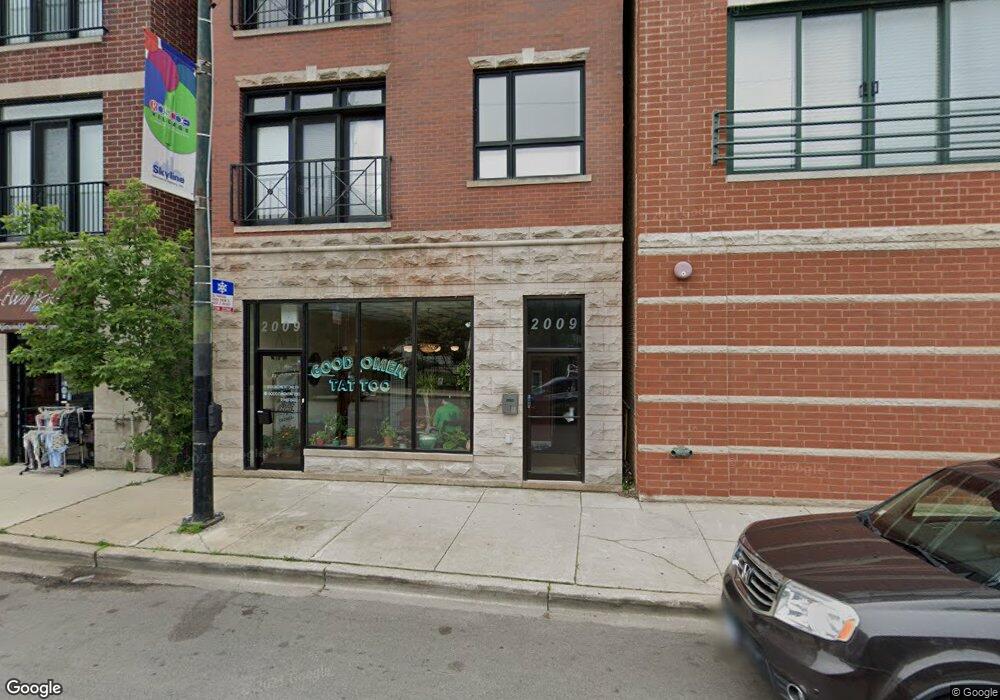
2009 W Belmont Ave Unit C1 Chicago, IL 60618
Roscoe Village Neighborhood
--
Bed
--
Bath
--
Sq Ft
0.8
Acres
About This Home
This home is located at 2009 W Belmont Ave Unit C1, Chicago, IL 60618. 2009 W Belmont Ave Unit C1 is a home located in Cook County with nearby schools including Jahn School of Fine Arts, Lake View High School, and Saint Luke Academy.
Ownership History
Date
Name
Owned For
Owner Type
Purchase Details
Closed on
Feb 16, 2017
Sold by
Gulf Coast Bank & Trust Co
Bought by
Mon Ami Realty Llc Nhs Llc
Purchase Details
Closed on
Jul 25, 2016
Sold by
Kobylarczyk Katarzyna and Kobylarczyk Boguslaw
Bought by
Gulf Coast Bank & Trust Co
Purchase Details
Closed on
Jan 19, 2010
Sold by
Thrash Karen R
Bought by
Kobylarczyk Boguslaw and Kobylarczyk Katarzyna
Home Financials for this Owner
Home Financials are based on the most recent Mortgage that was taken out on this home.
Original Mortgage
$151,000
Interest Rate
5.09%
Mortgage Type
Commercial
Purchase Details
Closed on
Sep 23, 2003
Sold by
R & B Builders Inc
Bought by
Thrash Karen R
Home Financials for this Owner
Home Financials are based on the most recent Mortgage that was taken out on this home.
Original Mortgage
$150,000
Interest Rate
6.1%
Mortgage Type
Commercial
Create a Home Valuation Report for This Property
The Home Valuation Report is an in-depth analysis detailing your home's value as well as a comparison with similar homes in the area
Home Values in the Area
Average Home Value in this Area
Purchase History
| Date | Buyer | Sale Price | Title Company |
|---|---|---|---|
| Mon Ami Realty Llc Nhs Llc | $119,500 | Greater Illionis Title | |
| Gulf Coast Bank & Trust Co | -- | None Available | |
| Kobylarczyk Boguslaw | $302,000 | Multiple | |
| Thrash Karen R | $179,500 | Cti |
Source: Public Records
Mortgage History
| Date | Status | Borrower | Loan Amount |
|---|---|---|---|
| Previous Owner | Kobylarczyk Boguslaw | $151,000 | |
| Previous Owner | Thrash Karen R | $150,000 |
Source: Public Records
Tax History Compared to Growth
Tax History
| Year | Tax Paid | Tax Assessment Tax Assessment Total Assessment is a certain percentage of the fair market value that is determined by local assessors to be the total taxable value of land and additions on the property. | Land | Improvement |
|---|---|---|---|---|
| 2024 | $16,584 | $90,000 | $7,042 | $82,958 |
| 2023 | $16,167 | $78,601 | $7,041 | $71,560 |
| 2022 | $16,167 | $78,601 | $7,041 | $71,560 |
| 2021 | $15,806 | $78,600 | $7,040 | $71,560 |
| 2020 | $17,142 | $76,950 | $7,041 | $69,909 |
| 2019 | $17,581 | $87,504 | $7,041 | $80,463 |
| 2018 | $5,889 | $29,812 | $7,041 | $22,771 |
| 2017 | $6,418 | $29,812 | $5,868 | $23,944 |
| 2016 | $24,289 | $121,270 | $5,868 | $115,402 |
| 2015 | $22,222 | $121,270 | $5,868 | $115,402 |
| 2014 | $16,150 | $87,042 | $5,105 | $81,937 |
| 2013 | $15,831 | $87,042 | $5,105 | $81,937 |
Source: Public Records
Map
Nearby Homes
- 2011 W Belmont Ave Unit 208
- 2027 W Belmont Ave Unit 1
- 1935 W Belmont Ave Unit 2
- 1955 W Melrose St Unit 2
- 2020 W Barry Ave
- 3137 N Hoyne Ave
- 3205 N Hoyne Ave Unit 2A
- 2034 W Melrose St
- 2118 W Melrose St
- 3040 N Hoyne Ave
- 2140 W Belmont Ave Unit 1
- 3302 N Hoyne Ave
- 3306 N Hoyne Ave
- 3140 N Leavitt St
- 3015 N Hamilton Ave
- 2209 W Belmont Ave Unit 3
- 3342 N Hoyne Ave
- 2941 N Damen Ave Unit 2
- 3201 N Ravenswood Ave Unit 301
- 2228 W Belmont Ave Unit 2
- 2009 W Belmont Ave
- 2009 W Belmont Ave Unit 4
- 2009 W Belmont Ave Unit 3
- 2009 W Belmont Ave Unit COM
- 2007 W Belmont Ave Unit 3P
- 2007 W Belmont Ave Unit 4W
- 2007 W Belmont Ave Unit 4E
- 2007 W Belmont Ave Unit 3W
- 2007 W Belmont Ave Unit 3E
- 2007 W Belmont Ave Unit 3N
- 2007 W Belmont Ave Unit 2N
- 2007 W Belmont Ave Unit P11
- 2007 W Belmont Ave Unit P10
- 2007 W Belmont Ave Unit P8
- 2007 W Belmont Ave Unit P7
- 2007 W Belmont Ave Unit P6
- 2007 W Belmont Ave Unit P5
- 2007 W Belmont Ave Unit 4P
- 2007 W Belmont Ave Unit P1