2009 W Chase Ave Chicago, IL 60645
Rogers Park NeighborhoodEstimated Value: $269,000 - $367,000
2
Beds
2
Baths
1,301
Sq Ft
$252/Sq Ft
Est. Value
About This Home
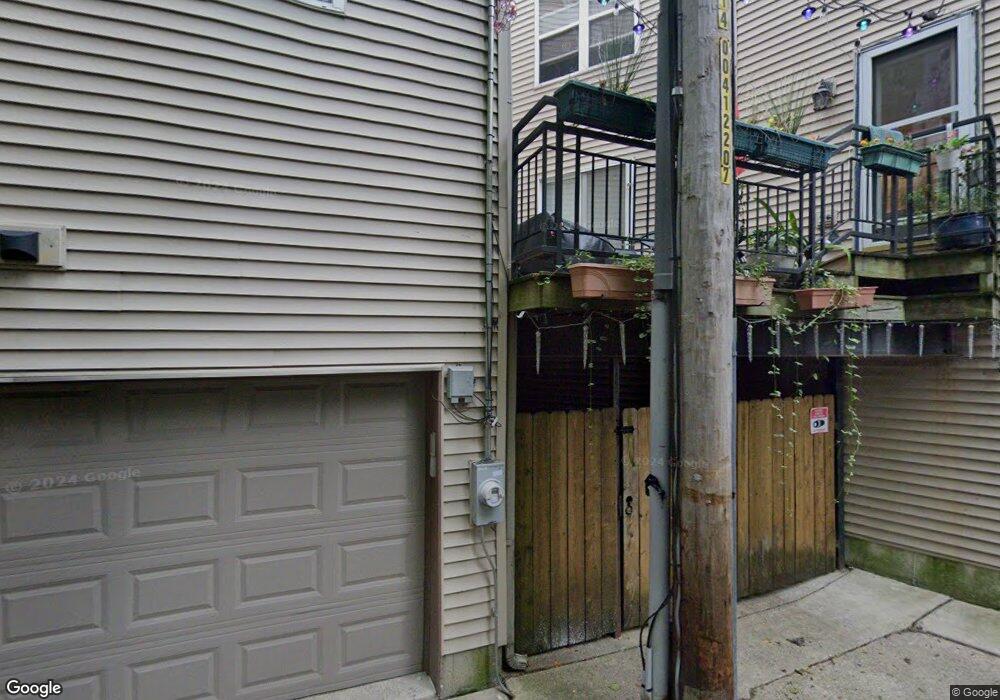
This home is located at 2009 W Chase Ave, Chicago, IL 60645 and is currently estimated at $328,364, approximately $252 per square foot. 2009 W Chase Ave is a home located in Cook County with nearby schools including George Armstrong Elementary School, Sullivan High School, and Acero - Sor Juana Ines de la Cruz School.
Ownership History
Date
Name
Owned For
Owner Type
Purchase Details
Closed on
Mar 28, 2008
Sold by
Cahan Mark R
Bought by
Daniel Olumide and Daniel Clementina D
Current Estimated Value
Home Financials for this Owner
Home Financials are based on the most recent Mortgage that was taken out on this home.
Original Mortgage
$219,450
Outstanding Balance
$139,046
Interest Rate
6.32%
Mortgage Type
Unknown
Estimated Equity
$189,318
Purchase Details
Closed on
Feb 25, 2008
Sold by
Osinaike Modupe
Bought by
Cahan Mark R
Home Financials for this Owner
Home Financials are based on the most recent Mortgage that was taken out on this home.
Original Mortgage
$219,450
Outstanding Balance
$139,046
Interest Rate
6.32%
Mortgage Type
Unknown
Estimated Equity
$189,318
Purchase Details
Closed on
Feb 16, 2005
Sold by
Smith Ibidayo
Bought by
Osinaike Modupe
Home Financials for this Owner
Home Financials are based on the most recent Mortgage that was taken out on this home.
Original Mortgage
$220,000
Interest Rate
7%
Mortgage Type
Unknown
Purchase Details
Closed on
Sep 10, 2002
Sold by
Dubin Residential Communities Corp
Bought by
Smith Ibidayo
Create a Home Valuation Report for This Property
The Home Valuation Report is an in-depth analysis detailing your home's value as well as a comparison with similar homes in the area
Home Values in the Area
Average Home Value in this Area
Purchase History
| Date | Buyer | Sale Price | Title Company |
|---|---|---|---|
| Daniel Olumide | $231,000 | Lawyers | |
| Cahan Mark R | -- | Lawyers | |
| Osinaike Modupe | $275,000 | Atgf Inc | |
| Smith Ibidayo | $237,500 | Cti |
Source: Public Records
Mortgage History
| Date | Status | Borrower | Loan Amount |
|---|---|---|---|
| Open | Daniel Olumide | $219,450 | |
| Previous Owner | Osinaike Modupe | $220,000 | |
| Closed | Osinaike Modupe | $55,000 |
Source: Public Records
Tax History
| Year | Tax Paid | Tax Assessment Tax Assessment Total Assessment is a certain percentage of the fair market value that is determined by local assessors to be the total taxable value of land and additions on the property. | Land | Improvement |
|---|---|---|---|---|
| 2025 | $4,269 | $28,279 | $1,782 | $26,497 |
| 2024 | $4,269 | $28,279 | $1,782 | $26,497 |
| 2023 | $4,140 | $23,548 | $1,415 | $22,133 |
| 2022 | $4,140 | $23,548 | $1,415 | $22,133 |
| 2021 | $4,065 | $23,547 | $1,414 | $22,133 |
| 2020 | $3,524 | $18,923 | $2,751 | $16,172 |
| 2019 | $3,549 | $21,096 | $2,751 | $18,345 |
| 2018 | $3,489 | $21,096 | $2,751 | $18,345 |
| 2017 | $2,785 | $16,311 | $2,436 | $13,875 |
| 2016 | $2,767 | $16,311 | $2,436 | $13,875 |
| 2015 | $2,508 | $16,311 | $2,436 | $13,875 |
| 2014 | $2,494 | $16,010 | $2,358 | $13,652 |
| 2013 | $2,434 | $16,010 | $2,358 | $13,652 |
Source: Public Records
Map
Nearby Homes
- 7227 N Damen Ave
- 7123 N Damen Ave Unit 6E
- 1908 W Chase Ave Unit 203
- 2044 W Jarvis Ave Unit 3G
- 7334 N Winchester Ave Unit 2E
- 7338 N Winchester Ave Unit C
- 7355 N Ridge Blvd Unit 2A
- 7411 N Hoyne Ave Unit 3
- 2033 W Fargo Ave Unit 2
- 7431 N Hoyne Ave Unit G
- 2000 W Greenleaf Ave Unit 1
- 1942 W Fargo Ave
- 2008 W Greenleaf Ave Unit 3
- 1815 W Touhy Ave Unit 1
- 7341 N Honore St
- 7420 N Winchester Ave Unit 2A
- 7453 N Hoyne Ave Unit 3S
- 2175 W Touhy Ave
- 7252 N Bell Ave
- 1842 W Greenleaf Ave
- 2009 W Chase Ave
- 2009 W Chase Ave
- 2009 W Chase Ave
- 2009 W Chase Ave Unit 4
- 2009 W Chase Ave Unit 3
- 2011 W Chase Ave
- 2011 W Chase Ave
- 2011 W Chase Ave
- 2011 W Chase Ave
- 2011 W Chase Ave
- 2011 W Chase Ave Unit 5
- 2011 W Chase Ave Unit 3
- 7266 N Rogers Ave
- 7268 N Rogers Ave
- 7264 N Rogers Ave
- 7262 N Rogers Ave
- 7262 N Rogers Ave Unit 7262
- 7270 N Rogers Ave
- 7260 N Rogers Ave
- 7240 N Damen Ave
Your Personal Tour Guide
Ask me questions while you tour the home.