Estimated Value: $317,956 - $364,000
4
Beds
2
Baths
1,927
Sq Ft
$177/Sq Ft
Est. Value
About This Home
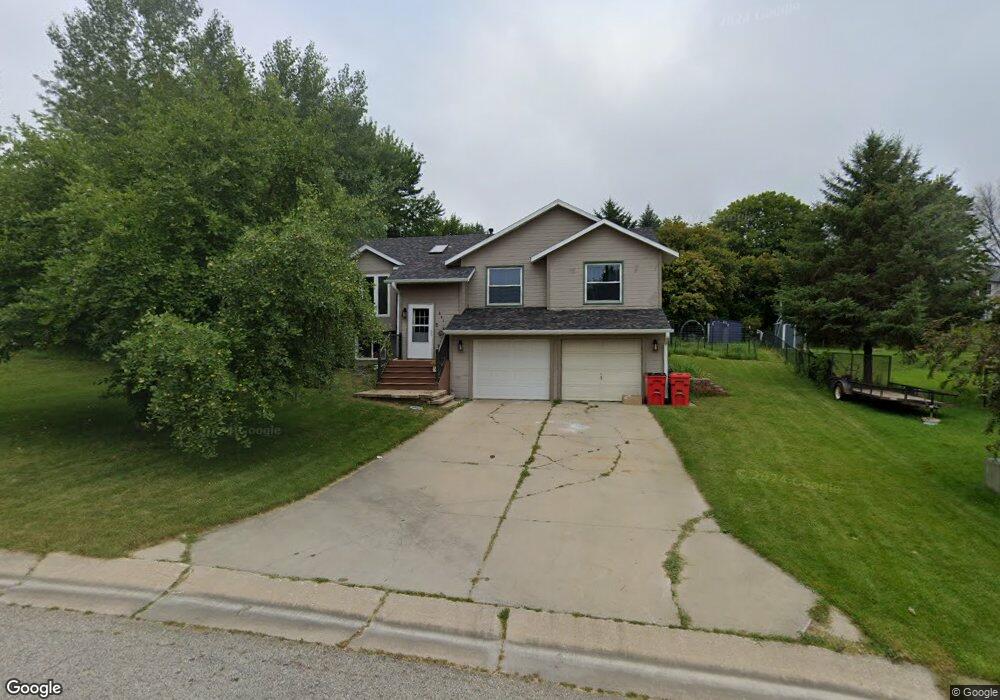
This home is located at 201 201 8th-Street-ne, Byron, MN 55920 and is currently estimated at $341,739, approximately $177 per square foot. 201 201 8th-Street-ne is a home located in Olmsted County with nearby schools including Byron Intermediate School, Byron Middle School, and Byron Senior High School.
Ownership History
Date
Name
Owned For
Owner Type
Purchase Details
Closed on
Sep 22, 2020
Sold by
Kosiak Maureen A
Bought by
August Daniel L and Greeness Janelle C
Current Estimated Value
Home Financials for this Owner
Home Financials are based on the most recent Mortgage that was taken out on this home.
Original Mortgage
$239,580
Interest Rate
2.8%
Mortgage Type
FHA
Purchase Details
Closed on
Sep 26, 2006
Sold by
Borchardt Todd A and Borchardt Michelle M
Bought by
Kosiak Maureen A
Home Financials for this Owner
Home Financials are based on the most recent Mortgage that was taken out on this home.
Original Mortgage
$159,900
Interest Rate
6.49%
Mortgage Type
Purchase Money Mortgage
Purchase Details
Closed on
Jun 28, 2005
Sold by
Borchardt Donald and Borchardt Betty
Bought by
Borchardt Todd A and Borchardt Michele M
Create a Home Valuation Report for This Property
The Home Valuation Report is an in-depth analysis detailing your home's value as well as a comparison with similar homes in the area
Home Values in the Area
Average Home Value in this Area
Purchase History
| Date | Buyer | Sale Price | Title Company |
|---|---|---|---|
| August Daniel L | $244,000 | None Available | |
| Kosiak Maureen A | $159,900 | Rochester Title | |
| Borchardt Todd A | -- | None Available | |
| August Daniel Daniel | $244,000 | -- |
Source: Public Records
Mortgage History
| Date | Status | Borrower | Loan Amount |
|---|---|---|---|
| Previous Owner | August Daniel L | $239,580 | |
| Previous Owner | Kosiak Maureen A | $159,900 | |
| Closed | August Daniel Daniel | $239,580 |
Source: Public Records
Tax History Compared to Growth
Tax History
| Year | Tax Paid | Tax Assessment Tax Assessment Total Assessment is a certain percentage of the fair market value that is determined by local assessors to be the total taxable value of land and additions on the property. | Land | Improvement |
|---|---|---|---|---|
| 2024 | $4,620 | $285,800 | $45,000 | $240,800 |
| 2023 | $4,444 | $281,100 | $40,000 | $241,100 |
| 2022 | $4,172 | $264,500 | $40,000 | $224,500 |
| 2021 | $3,496 | $227,400 | $40,000 | $187,400 |
| 2020 | $3,406 | $202,900 | $40,000 | $162,900 |
| 2019 | $3,188 | $192,500 | $35,000 | $157,500 |
| 2018 | $3,022 | $178,700 | $30,000 | $148,700 |
| 2017 | $2,954 | $170,000 | $25,000 | $145,000 |
| 2016 | $2,822 | $166,000 | $21,000 | $145,000 |
| 2015 | $2,750 | $154,700 | $21,000 | $133,700 |
| 2014 | $2,532 | $156,200 | $21,000 | $135,200 |
| 2012 | -- | $155,100 | $21,000 | $134,100 |
Source: Public Records
Map
Nearby Homes
- 910 Byron Ave N
- 925 Byron Ave N
- 1005 4th Ave NE
- 655 Somerby Pkwy NE
- 667 Somerby Pkwy NE
- 675 Somerby Pkwy NE
- 843 Somerby Pkwy NE
- 827 Somerby Pkwy NE
- 805 Somerby Pkwy NE
- 498 Somerby Pkwy NE
- 516 Somerby Pkwy NE
- 720 Somerby Pkwy NE
- 264 Somerby Pkwy NE
- 1406 Epperstone Enclave NE
- 244 Somerby Pkwy NE
- 785 Somerby Pkwy NE
- 226 Somerby Pkwy NE
- 208 Somerby Pkwy NE
- 813 Bridgeford Place NE
- 190 Somerby Pkwy NE
- 201 8th St NE
- 205 8th St NE
- 129 8th St NE
- 208 9th St NE
- 212 9th St NE
- 204 9th St NE
- 209 8th St NE
- 125 8th St NE
- 125 125 8th-Street-ne
- 200 8th St NE
- 216 9th St NE
- 812 2nd Ave NE
- 816 816 2nd-Avenue-ne
- 816 2nd Ave NE
- 801 3rd Ave NE
- 121 8th St NE
- 820 2nd Ave NE
- 130 8th St NE
- 721 3rd Ave NE
- 808 2nd Ave NE