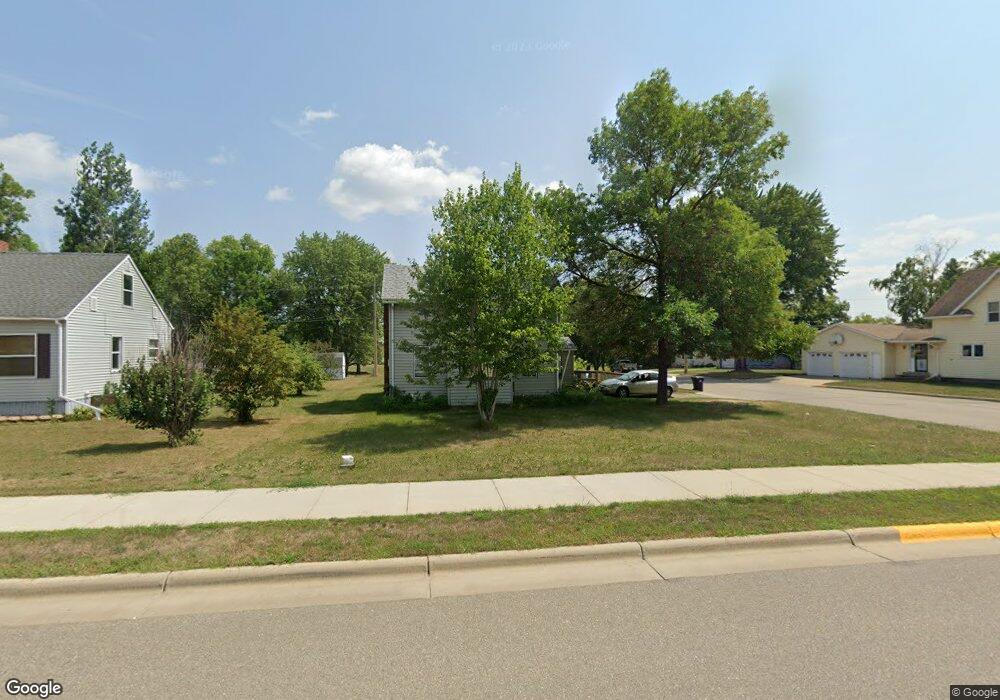
201 201 Main-Street-s Browerville, MN 56438
Estimated Value: $101,538 - $152,000
3
Beds
1
Bath
350
Sq Ft
$366/Sq Ft
Est. Value
About This Home
This home is located at 201 201 Main-Street-s, Browerville, MN 56438 and is currently estimated at $128,135, approximately $366 per square foot. 201 201 Main-Street-s is a home located in Todd County with nearby schools including John Tartan Elementary School, William & Mary Scherkenbach Elementary School, and Browerville Secondary School.
Ownership History
Date
Name
Owned For
Owner Type
Purchase Details
Closed on
Jul 16, 2009
Sold by
Peterson Gerald D
Bought by
Stalberger Jill L
Current Estimated Value
Purchase Details
Closed on
Oct 3, 2005
Sold by
Bleess Joyce A
Bought by
Abel Anne Julian Van
Home Financials for this Owner
Home Financials are based on the most recent Mortgage that was taken out on this home.
Original Mortgage
$63,900
Interest Rate
5.88%
Mortgage Type
Purchase Money Mortgage
Create a Home Valuation Report for This Property
The Home Valuation Report is an in-depth analysis detailing your home's value as well as a comparison with similar homes in the area
Home Values in the Area
Average Home Value in this Area
Purchase History
| Date | Buyer | Sale Price | Title Company |
|---|---|---|---|
| Stalberger Jill L | -- | None Available | |
| Abel Anne Julian Van | $83,000 | Todd County Title & Abstract |
Source: Public Records
Mortgage History
| Date | Status | Borrower | Loan Amount |
|---|---|---|---|
| Previous Owner | Abel Anne Julian Van | $63,900 |
Source: Public Records
Tax History Compared to Growth
Tax History
| Year | Tax Paid | Tax Assessment Tax Assessment Total Assessment is a certain percentage of the fair market value that is determined by local assessors to be the total taxable value of land and additions on the property. | Land | Improvement |
|---|---|---|---|---|
| 2025 | $936 | $89,100 | $3,500 | $85,600 |
| 2024 | $1,722 | $90,800 | $3,500 | $87,300 |
| 2023 | $776 | $84,300 | $3,500 | $80,800 |
| 2022 | $836 | $67,400 | $3,500 | $63,900 |
| 2021 | $1,528 | $61,400 | $3,500 | $57,900 |
| 2020 | $748 | $63,100 | $3,500 | $59,600 |
| 2019 | $786 | $48,300 | $3,500 | $44,800 |
| 2018 | $668 | $48,700 | $3,500 | $45,200 |
| 2017 | $664 | $35,300 | $3,500 | $31,800 |
| 2016 | $732 | $35,500 | $4,200 | $31,300 |
| 2015 | $686 | $0 | $0 | $0 |
| 2014 | -- | $0 | $0 | $0 |
Source: Public Records
Map
Nearby Homes