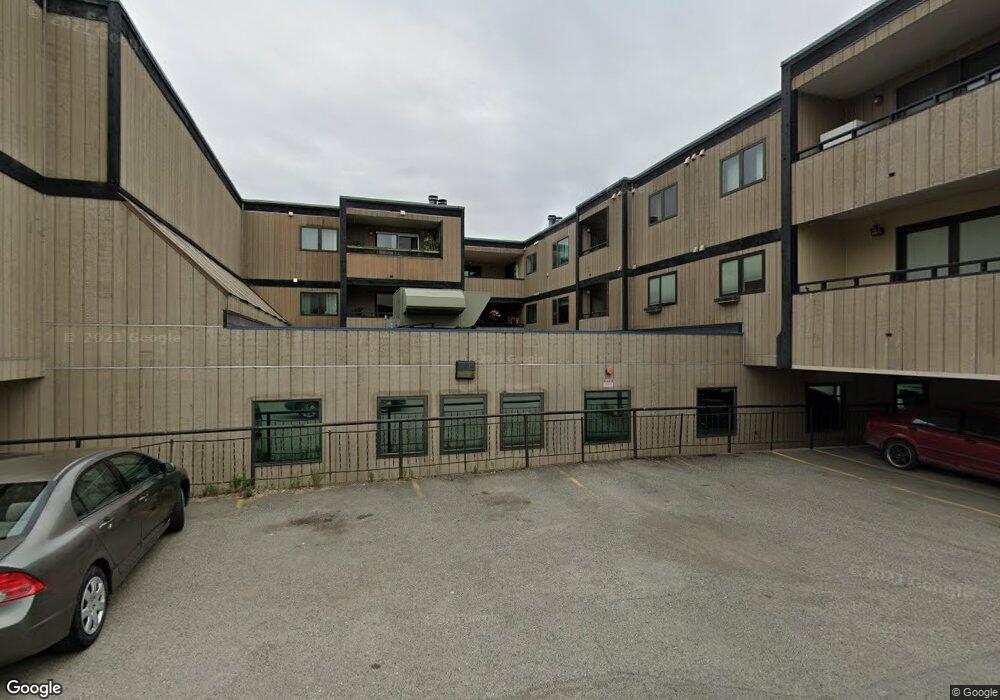
201 Barrow St Unit 209 Anchorage, AK 99501
Downtown Anchorage NeighborhoodEstimated Value: $171,000 - $282,000
2
Beds
2
Baths
1,110
Sq Ft
$214/Sq Ft
Est. Value
About This Home
This home is located at 201 Barrow St Unit 209, Anchorage, AK 99501 and is currently estimated at $237,131, approximately $213 per square foot. 201 Barrow St Unit 209 is a home located in Anchorage Municipality with nearby schools including Central Middle School of Science, West High School, and Denali Montessori.
Ownership History
Date
Name
Owned For
Owner Type
Purchase Details
Closed on
May 11, 2012
Sold by
Laux Robert H
Bought by
Graham Jacque M
Current Estimated Value
Home Financials for this Owner
Home Financials are based on the most recent Mortgage that was taken out on this home.
Original Mortgage
$185,940
Outstanding Balance
$128,612
Interest Rate
3.94%
Estimated Equity
$108,519
Purchase Details
Closed on
Jul 26, 2011
Sold by
Keoch Warren J and Keoch Sallyann
Bought by
Laux Robert H
Home Financials for this Owner
Home Financials are based on the most recent Mortgage that was taken out on this home.
Original Mortgage
$180,775
Interest Rate
4.46%
Purchase Details
Closed on
Nov 4, 2002
Sold by
Bresett Patricia S and Brown Morgan Bresett
Bought by
Keogh Warren J and Roys-Keogh Sally
Home Financials for this Owner
Home Financials are based on the most recent Mortgage that was taken out on this home.
Original Mortgage
$132,600
Interest Rate
5.99%
Mortgage Type
Purchase Money Mortgage
Purchase Details
Closed on
Nov 1, 2002
Sold by
Brown Morgan Bresett
Bought by
Keogh Warren J and Roys Keogh Sally
Home Financials for this Owner
Home Financials are based on the most recent Mortgage that was taken out on this home.
Original Mortgage
$132,600
Interest Rate
5.99%
Mortgage Type
Purchase Money Mortgage
Purchase Details
Closed on
Jan 30, 2002
Sold by
Cocklin Tami
Bought by
Bresett Patricia S
Create a Home Valuation Report for This Property
The Home Valuation Report is an in-depth analysis detailing your home's value as well as a comparison with similar homes in the area
Home Values in the Area
Average Home Value in this Area
Purchase History
| Date | Buyer | Sale Price | Title Company |
|---|---|---|---|
| Graham Jacque M | -- | Stewart Title Company | |
| Laux Robert H | -- | Atga | |
| Keogh Warren J | -- | -- | |
| Keogh Warren J | -- | -- | |
| Bresett Patricia S | -- | -- |
Source: Public Records
Mortgage History
| Date | Status | Borrower | Loan Amount |
|---|---|---|---|
| Open | Graham Jacque M | $185,940 | |
| Previous Owner | Laux Robert H | $180,775 | |
| Previous Owner | Keogh Warren J | $132,600 | |
| Previous Owner | Keogh Warren J | $132,600 |
Source: Public Records
Tax History Compared to Growth
Tax History
| Year | Tax Paid | Tax Assessment Tax Assessment Total Assessment is a certain percentage of the fair market value that is determined by local assessors to be the total taxable value of land and additions on the property. | Land | Improvement |
|---|---|---|---|---|
| 2025 | $3,350 | $254,700 | -- | $254,700 |
| 2024 | $3,350 | $207,500 | $0 | $207,500 |
| 2023 | $4,055 | $238,100 | $0 | $238,100 |
| 2022 | $3,942 | $234,100 | $0 | $234,100 |
| 2021 | $3,750 | $208,100 | $0 | $208,100 |
| 2020 | $3,808 | $224,000 | $0 | $224,000 |
| 2019 | $3,511 | $214,600 | $0 | $214,600 |
| 2018 | $3,608 | $220,000 | $0 | $220,000 |
| 2017 | $3,469 | $221,500 | $0 | $221,500 |
| 2016 | $313 | $214,100 | $0 | $214,100 |
| 2015 | $313 | $191,300 | $0 | $191,300 |
| 2014 | $313 | $177,000 | $0 | $177,000 |
Source: Public Records
Map
Nearby Homes
- 221 E 7th Ave Unit 114
- 221 E 7th Ave Unit 105
- 222 E 7th Ave Unit 106
- 721 Station Ln Unit A5
- 1 Unknown St
- 1625 C St
- 725 Station Ln Unit A6
- 793 Station Ln Unit A13
- 769 Station Ln Unit A11
- 129 E 11th Ave
- 1030 Denali St
- 211 W Manor Ave
- 915 Hyder St
- 1401 Hyder St
- 1003 D St
- 545 E 11th Ave
- 1170 Denali St Unit D433
- 1170 Denali St Unit 235
- L1 BL N Addn 4
- 624 Karluk St
- 201 Barrow St Unit 102C
- 201 Barrow St Unit 102B
- 201 Barrow St Unit 102A
- 201 Barrow St Unit 313
- 201 Barrow St Unit 312
- 201 Barrow St Unit 311
- 201 Barrow St Unit 310
- 201 Barrow St Unit 309
- 201 Barrow St Unit 308
- 201 Barrow St Unit 307
- 201 Barrow St Unit 306
- 201 Barrow St Unit 305
- 201 Barrow St Unit 304
- 201 Barrow St Unit 303
- 201 Barrow St Unit 302
- 201 Barrow St Unit 301
- 201 Barrow St Unit 213
- 201 Barrow St Unit 212
- 201 Barrow St Unit 211
- 201 Barrow St Unit 210