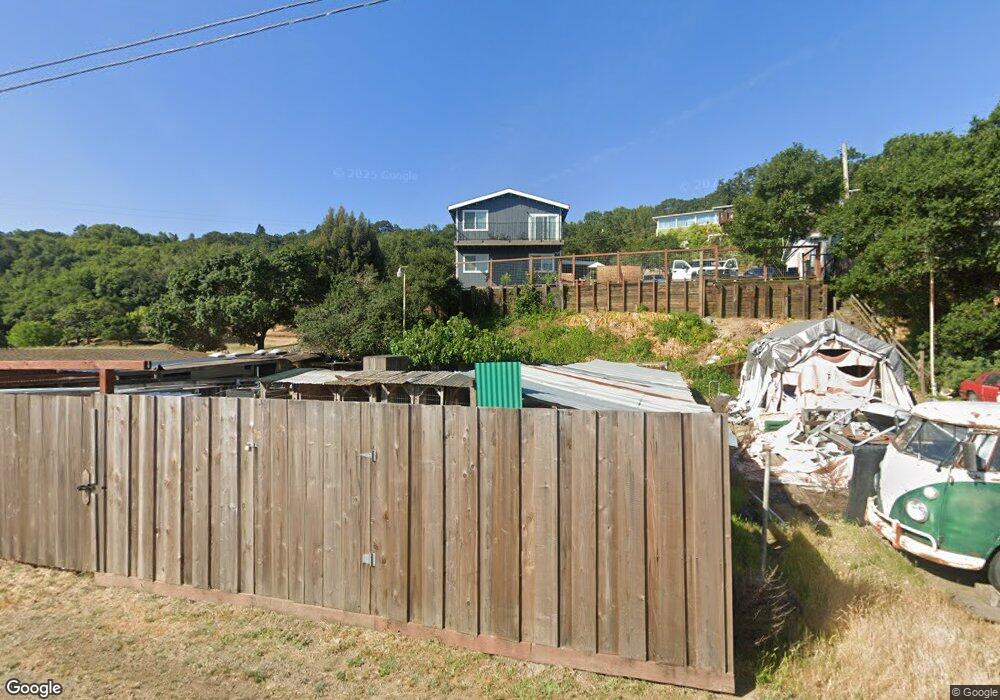
201 Channel Dr Novato, CA 94945
Green Point NeighborhoodEstimated Value: $940,012 - $1,085,000
2
Beds
2
Baths
1,509
Sq Ft
$667/Sq Ft
Est. Value
About This Home
This home is located at 201 Channel Dr, Novato, CA 94945 and is currently estimated at $1,007,253, approximately $667 per square foot. 201 Channel Dr is a home located in Marin County with nearby schools including Sinaloa Middle School and San Marin High School.
Ownership History
Date
Name
Owned For
Owner Type
Purchase Details
Closed on
Feb 2, 2017
Sold by
Sheridan Philip M and Sheridan Esther B
Bought by
Sheridan Philip M and Sheridan Esther B
Current Estimated Value
Purchase Details
Closed on
Aug 5, 1997
Sold by
Sheridan Esther B
Bought by
Sheridan Philip M
Home Financials for this Owner
Home Financials are based on the most recent Mortgage that was taken out on this home.
Original Mortgage
$85,000
Interest Rate
9.94%
Create a Home Valuation Report for This Property
The Home Valuation Report is an in-depth analysis detailing your home's value as well as a comparison with similar homes in the area
Home Values in the Area
Average Home Value in this Area
Purchase History
| Date | Buyer | Sale Price | Title Company |
|---|---|---|---|
| Sheridan Philip M | -- | None Available | |
| Sheridan Philip M | -- | Attorney | |
| Sheridan Philip M | -- | First American Title Co |
Source: Public Records
Mortgage History
| Date | Status | Borrower | Loan Amount |
|---|---|---|---|
| Previous Owner | Sheridan Philip M | $85,000 |
Source: Public Records
Tax History Compared to Growth
Tax History
| Year | Tax Paid | Tax Assessment Tax Assessment Total Assessment is a certain percentage of the fair market value that is determined by local assessors to be the total taxable value of land and additions on the property. | Land | Improvement |
|---|---|---|---|---|
| 2025 | $4,466 | $312,964 | $261,241 | $51,723 |
| 2024 | $4,466 | $306,827 | $256,119 | $50,708 |
| 2023 | $4,357 | $300,813 | $251,098 | $49,715 |
| 2022 | $4,246 | $294,900 | $246,167 | $48,733 |
| 2021 | $4,202 | $289,117 | $241,340 | $47,777 |
| 2020 | $4,162 | $286,153 | $238,866 | $47,287 |
| 2019 | $3,951 | $280,544 | $234,184 | $46,360 |
| 2018 | $3,896 | $275,044 | $229,593 | $45,451 |
| 2017 | $3,829 | $269,652 | $225,092 | $44,560 |
| 2016 | $3,569 | $264,366 | $220,679 | $43,687 |
| 2015 | $18,453 | $260,395 | $217,364 | $43,031 |
| 2014 | $3,423 | $255,295 | $213,107 | $42,188 |
Source: Public Records
Map
Nearby Homes