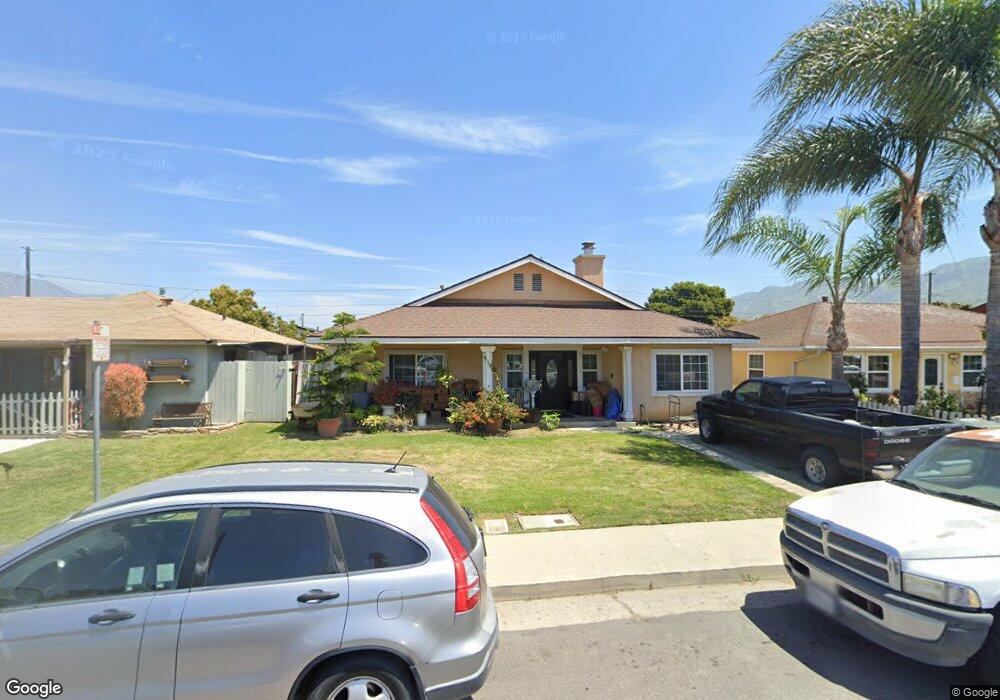
201 Craig Dr Santa Paula, CA 93060
Estimated Value: $598,000 - $743,160
4
Beds
3
Baths
864
Sq Ft
$805/Sq Ft
Est. Value
About This Home
This home is located at 201 Craig Dr, Santa Paula, CA 93060 and is currently estimated at $695,790, approximately $805 per square foot. 201 Craig Dr is a home located in Ventura County with nearby schools including Glen City Elementary School, Isbell Middle, and Santa Paula High.
Ownership History
Date
Name
Owned For
Owner Type
Purchase Details
Closed on
Nov 10, 2006
Sold by
Hernandez Aurelia
Bought by
Hernandez Margarito and Hernandez Aurelia
Current Estimated Value
Home Financials for this Owner
Home Financials are based on the most recent Mortgage that was taken out on this home.
Original Mortgage
$340,000
Interest Rate
6.28%
Mortgage Type
New Conventional
Purchase Details
Closed on
Oct 31, 2006
Sold by
Hernandez Margarito
Bought by
Hernandez Aurelia
Home Financials for this Owner
Home Financials are based on the most recent Mortgage that was taken out on this home.
Original Mortgage
$340,000
Interest Rate
6.28%
Mortgage Type
New Conventional
Purchase Details
Closed on
Jan 10, 2003
Sold by
Hernandez Margarito and Hernandez Aurelia
Bought by
Hernandez Margarito and Hernandez Aurelia
Create a Home Valuation Report for This Property
The Home Valuation Report is an in-depth analysis detailing your home's value as well as a comparison with similar homes in the area
Home Values in the Area
Average Home Value in this Area
Purchase History
| Date | Buyer | Sale Price | Title Company |
|---|---|---|---|
| Hernandez Margarito | -- | First American Title Company | |
| Hernandez Aurelia | -- | First American Title Company | |
| Hernandez Margarito | -- | -- |
Source: Public Records
Mortgage History
| Date | Status | Borrower | Loan Amount |
|---|---|---|---|
| Closed | Hernandez Aurelia | $340,000 |
Source: Public Records
Tax History Compared to Growth
Tax History
| Year | Tax Paid | Tax Assessment Tax Assessment Total Assessment is a certain percentage of the fair market value that is determined by local assessors to be the total taxable value of land and additions on the property. | Land | Improvement |
|---|---|---|---|---|
| 2025 | $4,570 | $405,093 | $163,132 | $241,961 |
| 2024 | $4,570 | $397,150 | $159,933 | $237,217 |
| 2023 | $4,474 | $389,363 | $156,797 | $232,566 |
| 2022 | $4,343 | $381,729 | $153,723 | $228,006 |
| 2021 | $4,329 | $374,245 | $150,709 | $223,536 |
| 2020 | $4,308 | $370,409 | $149,164 | $221,245 |
| 2019 | $4,071 | $363,147 | $146,240 | $216,907 |
| 2018 | $4,019 | $356,027 | $143,373 | $212,654 |
| 2017 | $4,064 | $349,047 | $140,562 | $208,485 |
| 2016 | $3,819 | $342,204 | $137,806 | $204,398 |
| 2015 | $3,649 | $337,066 | $135,737 | $201,329 |
| 2014 | $3,706 | $330,465 | $133,079 | $197,386 |
Source: Public Records
Map
Nearby Homes
- 102 E Ventura St Unit D
- 102 E Ventura St Unit A
- 33 Outer Dr Unit 33
- 352 Moultrie Place
- 107 Sonoma Ln
- 1848 Jojoba Dr
- 413 Checkerbloom Ln
- 1856 Jojoba Dr
- 1865 Jojoba Dr
- 455 Snowdrop Ln
- 457 Snowdrop Ln
- 324 W Santa Barbara St
- 362 W Santa Barbara St
- 154 E Santa Maria St
- 336 E Harvard Blvd
- 525 W Santa Barbara St
- 0 Dickenson Rd
- 605 Elfred Ct
- 342 Princeton St
- 545 W Santa Paula St