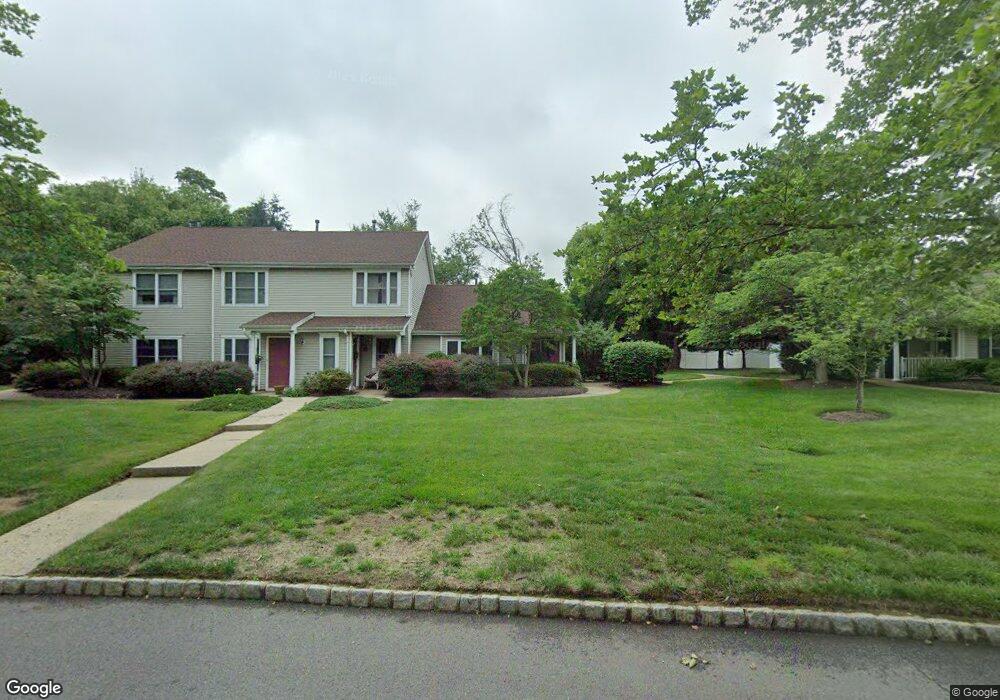
201 Danser Dr Unit 36 Cranbury, NJ 08512
Estimated Value: $122,000 - $159,267
--
Bed
--
Bath
683
Sq Ft
$204/Sq Ft
Est. Value
About This Home
This home is located at 201 Danser Dr Unit 36, Cranbury, NJ 08512 and is currently estimated at $139,089, approximately $203 per square foot. 201 Danser Dr Unit 36 is a home located in Middlesex County with nearby schools including The Cranbury School, SciCore Academy, and E Windsor Knowledge Beginnings.
Ownership History
Date
Name
Owned For
Owner Type
Purchase Details
Closed on
Feb 13, 2011
Sold by
Craparotta Renee
Bought by
Bunce Raymond
Current Estimated Value
Home Financials for this Owner
Home Financials are based on the most recent Mortgage that was taken out on this home.
Original Mortgage
$25,000
Outstanding Balance
$17,091
Interest Rate
4.76%
Mortgage Type
New Conventional
Estimated Equity
$121,998
Purchase Details
Closed on
Feb 24, 2006
Sold by
Mawn Lisa
Bought by
Craparotta Renee
Home Financials for this Owner
Home Financials are based on the most recent Mortgage that was taken out on this home.
Original Mortgage
$66,200
Interest Rate
6.27%
Create a Home Valuation Report for This Property
The Home Valuation Report is an in-depth analysis detailing your home's value as well as a comparison with similar homes in the area
Home Values in the Area
Average Home Value in this Area
Purchase History
| Date | Buyer | Sale Price | Title Company |
|---|---|---|---|
| Bunce Raymond | $74,661 | Allied Title Llc | |
| Craparotta Renee | $66,200 | -- |
Source: Public Records
Mortgage History
| Date | Status | Borrower | Loan Amount |
|---|---|---|---|
| Open | Bunce Raymond | $25,000 | |
| Previous Owner | Craparotta Renee | $66,200 |
Source: Public Records
Tax History Compared to Growth
Tax History
| Year | Tax Paid | Tax Assessment Tax Assessment Total Assessment is a certain percentage of the fair market value that is determined by local assessors to be the total taxable value of land and additions on the property. | Land | Improvement |
|---|---|---|---|---|
| 2025 | $1,253 | $68,300 | $30,000 | $38,300 |
| 2024 | $1,235 | $68,300 | $30,000 | $38,300 |
| 2023 | $1,235 | $68,300 | $30,000 | $38,300 |
| 2022 | $1,217 | $68,300 | $30,000 | $38,300 |
| 2021 | $656 | $68,300 | $30,000 | $38,300 |
| 2020 | $1,216 | $68,300 | $30,000 | $38,300 |
| 2019 | $1,229 | $68,300 | $30,000 | $38,300 |
| 2018 | $1,345 | $68,300 | $30,000 | $38,300 |
| 2017 | $1,309 | $68,300 | $30,000 | $38,300 |
| 2016 | $1,320 | $68,300 | $30,000 | $38,300 |
| 2015 | $1,296 | $68,300 | $30,000 | $38,300 |
Source: Public Records
Map
Nearby Homes
- 86 Labaw Dr
- 8 Arthur Ln
- 2 Arthur Ln
- 5 Trowbridge Ln
- 5 Arthur Ln
- 110 S Main St
- 24 Haymarket Ct
- 41 Haymarket Ct
- 75 N Main St
- 47 Garden View Terrace Unit 4
- 47 Garden View Terrace
- 50 -18 Garden View Terrace
- 30 Frost Ln
- 14 Hightstown Cranbury Station Rd
- 0-0 Route 130
- 6 Ryan Rd
- 4 Sandstone Rd
- 148 Einstein Way
- 124 Mill Run E Unit 85