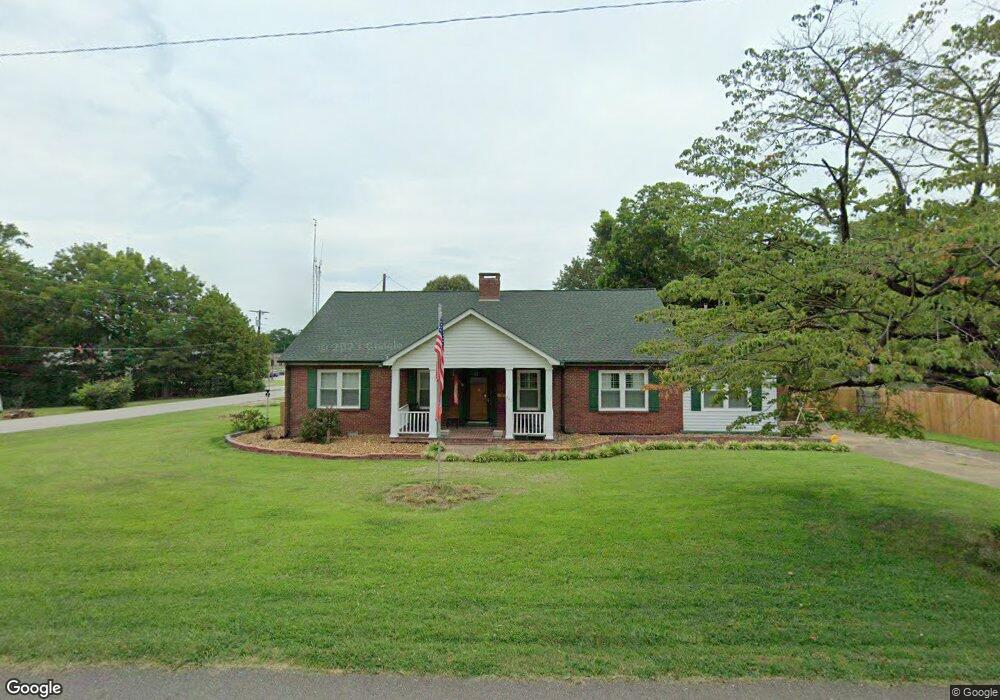
201 E 10th St Trenton, TN 38382
Estimated Value: $228,000 - $303,000
--
Bed
2
Baths
3,475
Sq Ft
$75/Sq Ft
Est. Value
About This Home
This home is located at 201 E 10th St, Trenton, TN 38382 and is currently estimated at $260,996, approximately $75 per square foot. 201 E 10th St is a home located in Gibson County with nearby schools including Trenton Elementary School, Trenton Middle School, and Peabody High School.
Ownership History
Date
Name
Owned For
Owner Type
Purchase Details
Closed on
Aug 4, 2015
Sold by
Etvir Youree Beverly B
Bought by
Youree Mack Moore And Beverly Buford Youree T
Current Estimated Value
Purchase Details
Closed on
Jan 13, 2007
Sold by
Youree Beverly B
Bought by
Youree Beverly Buford
Purchase Details
Closed on
Jul 24, 1989
Bought by
Buford Buford B and Buford Rebecca
Purchase Details
Closed on
Aug 12, 1949
Bought by
Buford Buford B and Buford Rebecca
Create a Home Valuation Report for This Property
The Home Valuation Report is an in-depth analysis detailing your home's value as well as a comparison with similar homes in the area
Home Values in the Area
Average Home Value in this Area
Purchase History
| Date | Buyer | Sale Price | Title Company |
|---|---|---|---|
| Youree Mack Moore And Beverly Buford Youree T | -- | -- | |
| Youree Beverly Buford | -- | -- | |
| Buford Buford B | $200 | -- | |
| Buford Buford B | -- | -- |
Source: Public Records
Tax History Compared to Growth
Tax History
| Year | Tax Paid | Tax Assessment Tax Assessment Total Assessment is a certain percentage of the fair market value that is determined by local assessors to be the total taxable value of land and additions on the property. | Land | Improvement |
|---|---|---|---|---|
| 2025 | $2,274 | $64,375 | $0 | $0 |
| 2024 | $2,274 | $64,375 | $3,250 | $61,125 |
| 2023 | $1,335 | $41,550 | $3,250 | $38,300 |
| 2022 | $1,306 | $41,550 | $3,250 | $38,300 |
| 2021 | $1,306 | $41,550 | $3,250 | $38,300 |
| 2020 | $1,961 | $41,075 | $3,250 | $37,825 |
| 2019 | $1,961 | $41,075 | $3,250 | $37,825 |
| 2018 | $1,912 | $39,925 | $3,250 | $36,675 |
| 2017 | $1,892 | $39,925 | $3,250 | $36,675 |
| 2016 | $1,892 | $39,925 | $3,250 | $36,675 |
| 2015 | $1,869 | $39,925 | $3,250 | $36,675 |
| 2014 | $1,840 | $39,925 | $3,250 | $36,675 |
Source: Public Records
Map
Nearby Homes