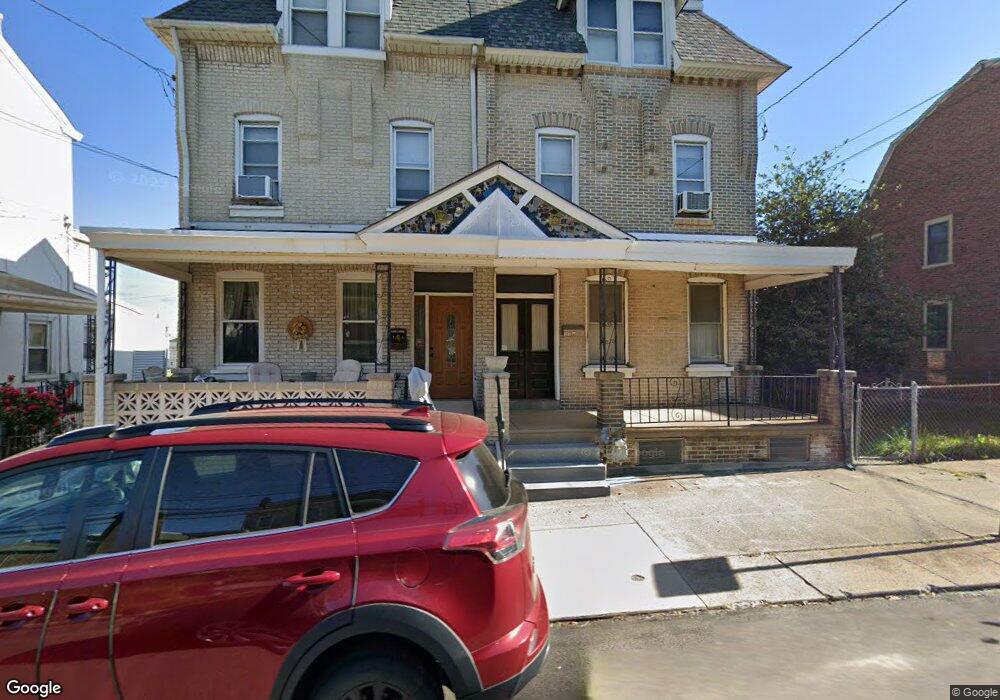
201 E 4th St Bridgeport, PA 19405
Estimated Value: $163,000 - $414,000
3
Beds
2
Baths
2,807
Sq Ft
$123/Sq Ft
Est. Value
About This Home
This home is located at 201 E 4th St, Bridgeport, PA 19405 and is currently estimated at $344,511, approximately $122 per square foot. 201 E 4th St is a home located in Montgomery County with nearby schools including Bridgeport Elementary School, Upper Merion Middle School, and Upper Merion High School.
Ownership History
Date
Name
Owned For
Owner Type
Purchase Details
Closed on
Sep 21, 2014
Sold by
Pol Luis A and Taglioli Pol Dawn M
Bought by
Taglioli Pol Dawn M
Current Estimated Value
Home Financials for this Owner
Home Financials are based on the most recent Mortgage that was taken out on this home.
Original Mortgage
$186,107
Outstanding Balance
$141,042
Interest Rate
3.87%
Mortgage Type
FHA
Estimated Equity
$203,469
Create a Home Valuation Report for This Property
The Home Valuation Report is an in-depth analysis detailing your home's value as well as a comparison with similar homes in the area
Home Values in the Area
Average Home Value in this Area
Purchase History
| Date | Buyer | Sale Price | Title Company |
|---|---|---|---|
| Taglioli Pol Dawn M | -- | None Available |
Source: Public Records
Mortgage History
| Date | Status | Borrower | Loan Amount |
|---|---|---|---|
| Open | Taglioli Pol Dawn M | $186,107 |
Source: Public Records
Tax History
| Year | Tax Paid | Tax Assessment Tax Assessment Total Assessment is a certain percentage of the fair market value that is determined by local assessors to be the total taxable value of land and additions on the property. | Land | Improvement |
|---|---|---|---|---|
| 2025 | $3,211 | $104,160 | $51,300 | $52,860 |
| 2024 | $3,211 | $104,160 | $51,300 | $52,860 |
| 2023 | $3,096 | $104,160 | $51,300 | $52,860 |
| 2022 | $2,964 | $104,160 | $51,300 | $52,860 |
| 2021 | $2,872 | $104,160 | $51,300 | $52,860 |
| 2020 | $2,744 | $104,160 | $51,300 | $52,860 |
| 2019 | $2,698 | $104,160 | $51,300 | $52,860 |
Source: Public Records
Map
Nearby Homes
- 13 Ford St Unit A
- 13 Ford St Unit B
- 39 E Front St
- 35 E Front St
- 33 E Front St
- 26 Atkins Dr
- 26 Anderson Dr
- 312 E Rambo St
- 530 Grove St
- 823 Coates St
- 39 2nd St
- 507 E Lafayette St
- 657 Columbus St
- 947 Coates St Unit 19 COATES ST
- 115 W 4th St
- 715 Bradley St Unit 21
- 254 E Main St
- 438 E Airy St
- 601 Green St
- 617 Coates Ln Unit C5
Your Personal Tour Guide
Ask me questions while you tour the home.