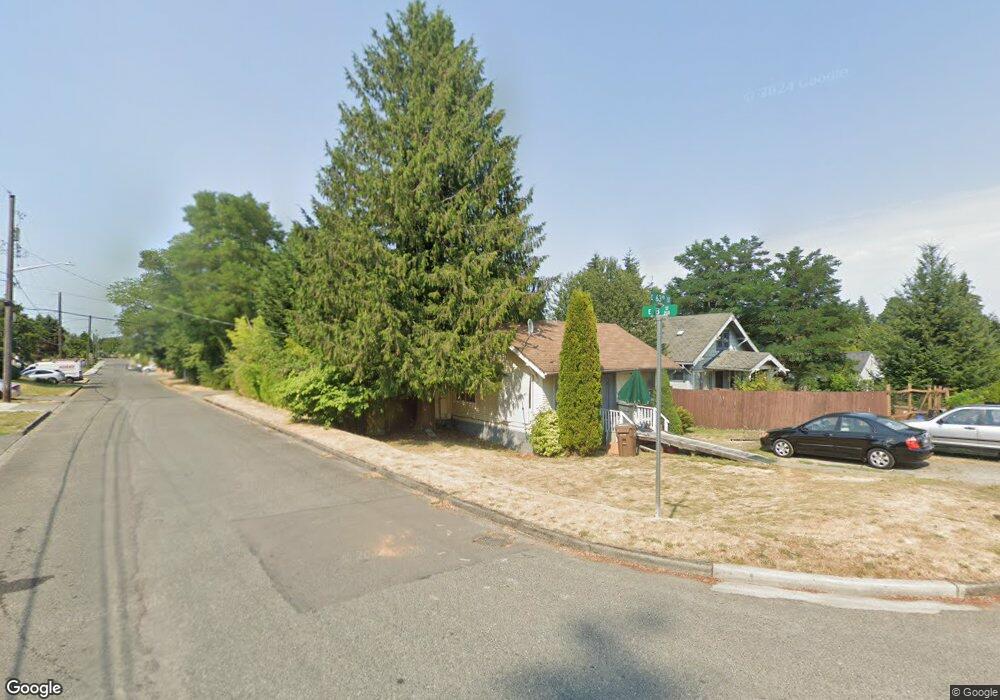
201 E 63rd St Tacoma, WA 98404
Eastside NeighborhoodEstimated Value: $335,000 - $360,000
3
Beds
1
Bath
791
Sq Ft
$437/Sq Ft
Est. Value
About This Home
This home is located at 201 E 63rd St, Tacoma, WA 98404 and is currently estimated at $345,657, approximately $436 per square foot. 201 E 63rd St is a home located in Pierce County with nearby schools including Oakland High School, Hunt Middle School, and Mount Tahoma High School.
Ownership History
Date
Name
Owned For
Owner Type
Purchase Details
Closed on
Oct 12, 2024
Sold by
Frazer Jane P
Bought by
Frazer Jane P
Current Estimated Value
Home Financials for this Owner
Home Financials are based on the most recent Mortgage that was taken out on this home.
Original Mortgage
$415,500
Interest Rate
6.17%
Mortgage Type
Credit Line Revolving
Purchase Details
Closed on
Aug 12, 2009
Sold by
Davison Douglas A
Bought by
Frazer Jane P
Purchase Details
Closed on
Jun 9, 2006
Sold by
Davison Doug
Bought by
Davison Doug and Frazer Jane
Home Financials for this Owner
Home Financials are based on the most recent Mortgage that was taken out on this home.
Original Mortgage
$155,800
Interest Rate
2.25%
Mortgage Type
Fannie Mae Freddie Mac
Purchase Details
Closed on
May 31, 2005
Sold by
Lawson Mark A
Bought by
Davison Doug
Home Financials for this Owner
Home Financials are based on the most recent Mortgage that was taken out on this home.
Original Mortgage
$115,960
Interest Rate
7.3%
Mortgage Type
Purchase Money Mortgage
Purchase Details
Closed on
Feb 12, 1998
Sold by
Lawson Mark A
Bought by
Lawson Mark A and Lawson Jodie
Home Financials for this Owner
Home Financials are based on the most recent Mortgage that was taken out on this home.
Original Mortgage
$57,600
Interest Rate
6.98%
Purchase Details
Closed on
Dec 23, 1997
Sold by
Bowman Chilton A
Bought by
Lawson Mark A and The 201 East 63Rd Street Land Trust
Home Financials for this Owner
Home Financials are based on the most recent Mortgage that was taken out on this home.
Original Mortgage
$57,600
Interest Rate
6.98%
Purchase Details
Closed on
Oct 10, 1997
Sold by
Partner Kimberly J
Bought by
Bowman Chilton A and Bowman Frances R
Home Financials for this Owner
Home Financials are based on the most recent Mortgage that was taken out on this home.
Original Mortgage
$48,000
Interest Rate
7.54%
Mortgage Type
Seller Take Back
Purchase Details
Closed on
May 25, 1995
Sold by
Bowman Chilton A and Bowman Frances R
Bought by
Partner Kimberly J
Home Financials for this Owner
Home Financials are based on the most recent Mortgage that was taken out on this home.
Original Mortgage
$48,000
Interest Rate
8.32%
Mortgage Type
Seller Take Back
Create a Home Valuation Report for This Property
The Home Valuation Report is an in-depth analysis detailing your home's value as well as a comparison with similar homes in the area
Home Values in the Area
Average Home Value in this Area
Purchase History
| Date | Buyer | Sale Price | Title Company |
|---|---|---|---|
| Frazer Jane P | -- | None Listed On Document | |
| Frazer Jane P | -- | None Available | |
| Davison Doug | $57,979 | Ticor Title Company | |
| Davison Doug | $144,950 | Stewart Title | |
| Lawson Mark A | $72,000 | Chicago Title Insurance Co | |
| Lawson Mark A | $52,352 | -- | |
| Bowman Chilton A | -- | -- | |
| Partner Kimberly J | $63,986 | -- |
Source: Public Records
Mortgage History
| Date | Status | Borrower | Loan Amount |
|---|---|---|---|
| Open | Frazer Jane P | $415,500 | |
| Previous Owner | Frazer Jane P | $415,500 | |
| Previous Owner | Davison Doug | $155,800 | |
| Previous Owner | Davison Doug | $115,960 | |
| Previous Owner | Lawson Mark A | $57,600 | |
| Previous Owner | Bowman Chilton A | $48,000 | |
| Previous Owner | Partner Kimberly J | $48,000 | |
| Closed | Davison Doug | $28,990 |
Source: Public Records
Tax History
| Year | Tax Paid | Tax Assessment Tax Assessment Total Assessment is a certain percentage of the fair market value that is determined by local assessors to be the total taxable value of land and additions on the property. | Land | Improvement |
|---|---|---|---|---|
| 2025 | $341 | $287,800 | $189,000 | $98,800 |
| 2024 | $341 | $276,200 | $182,100 | $94,100 |
| 2023 | $341 | $259,800 | $173,400 | $86,400 |
| 2022 | $344 | $272,200 | $162,200 | $110,000 |
| 2021 | $382 | $187,800 | $103,300 | $84,500 |
| 2019 | $415 | $165,300 | $85,400 | $79,900 |
| 2018 | $1,960 | $145,300 | $69,100 | $76,200 |
| 2017 | $1,734 | $123,800 | $55,300 | $68,500 |
Source: Public Records
Map
Nearby Homes
Your Personal Tour Guide
Ask me questions while you tour the home.