Estimated Value: $429,000 - $590,000
2
Beds
2
Baths
1,600
Sq Ft
$316/Sq Ft
Est. Value
About This Home
This home is located at 201 E Chestnut St Unit 21A, Chicago, IL 60611 and is currently estimated at $505,440, approximately $315 per square foot. 201 E Chestnut St Unit 21A is a home located in Cook County with nearby schools including Ogden Elementary School, Wells Community Academy High School, and Innovations HS of Arts Integration.
Ownership History
Date
Name
Owned For
Owner Type
Purchase Details
Closed on
Sep 3, 2009
Sold by
Craig Carole M
Bought by
Craig James W and Craig Jacqueline J
Current Estimated Value
Home Financials for this Owner
Home Financials are based on the most recent Mortgage that was taken out on this home.
Original Mortgage
$384,000
Outstanding Balance
$246,513
Interest Rate
5.15%
Mortgage Type
New Conventional
Estimated Equity
$258,927
Purchase Details
Closed on
Sep 6, 2005
Sold by
Hoffman Rudolph E and Will Of Marie M Hoffman
Bought by
Craig Carole M
Home Financials for this Owner
Home Financials are based on the most recent Mortgage that was taken out on this home.
Original Mortgage
$308,000
Interest Rate
5.88%
Mortgage Type
New Conventional
Create a Home Valuation Report for This Property
The Home Valuation Report is an in-depth analysis detailing your home's value as well as a comparison with similar homes in the area
Home Values in the Area
Average Home Value in this Area
Purchase History
| Date | Buyer | Sale Price | Title Company |
|---|---|---|---|
| Craig James W | -- | Stewart Title Company | |
| Craig Carole M | $385,000 | Cti |
Source: Public Records
Mortgage History
| Date | Status | Borrower | Loan Amount |
|---|---|---|---|
| Open | Craig James W | $384,000 | |
| Closed | Craig Carole M | $308,000 |
Source: Public Records
Tax History
| Year | Tax Paid | Tax Assessment Tax Assessment Total Assessment is a certain percentage of the fair market value that is determined by local assessors to be the total taxable value of land and additions on the property. | Land | Improvement |
|---|---|---|---|---|
| 2025 | $9,421 | $43,382 | $4,590 | $38,792 |
| 2024 | $9,421 | $43,382 | $4,590 | $38,792 |
| 2023 | $9,183 | $44,651 | $3,696 | $40,955 |
| 2022 | $9,183 | $44,651 | $3,696 | $40,955 |
| 2021 | $8,979 | $44,649 | $3,695 | $40,954 |
| 2020 | $8,908 | $39,987 | $2,587 | $37,400 |
| 2019 | $8,154 | $40,586 | $2,587 | $37,999 |
| 2018 | $8,017 | $40,586 | $2,587 | $37,999 |
| 2017 | $8,135 | $37,792 | $2,069 | $35,723 |
| 2016 | $7,569 | $37,792 | $2,069 | $35,723 |
| 2015 | $6,925 | $37,792 | $2,069 | $35,723 |
| 2014 | $5,604 | $34,609 | $1,663 | $32,946 |
| 2013 | $2,904 | $34,609 | $1,663 | $32,946 |
Source: Public Records
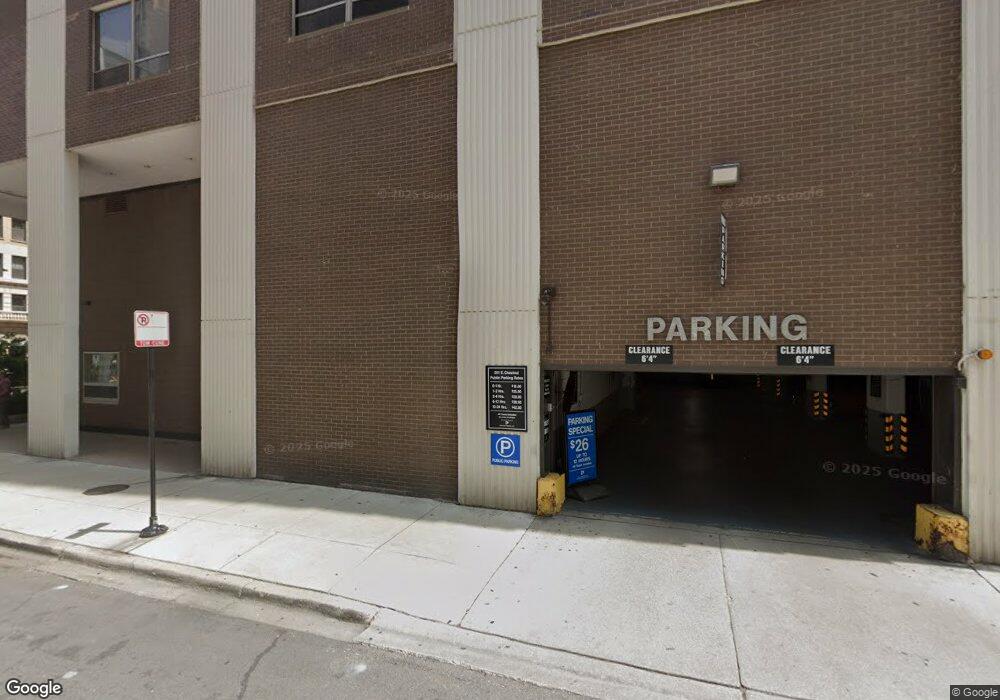
About This Building
Map
Nearby Homes
- 201 E Chestnut St Unit 21C
- 201 E Chestnut St Unit 22B
- 201 E Chestnut St Unit 19E
- 201 E Chestnut St Unit 23A
- 180 E Pearson St Unit 6802
- 180 E Pearson St Unit 6907
- 180 E Pearson St Unit 3704-3705
- 180 E Pearson St Unit 3807
- 180 E Pearson St Unit 3401
- 180 E Pearson St Unit 4002
- 180 E Pearson St Unit 4801
- 180 E Pearson St Unit 6401
- 247 E Chestnut St Unit 502
- 247 E Chestnut St Unit 1204
- 175 E Delaware Place Unit 5808
- 175 E Delaware Place Unit 5511
- 175 E Delaware Place Unit 4723
- 175 E Delaware Place Unit 4503
- 175 E Delaware Place Unit 5123
- 175 E Delaware Place Unit 8504
- 201 E Chestnut St Unit 20CE
- 201 E Chestnut St Unit 5CE
- 201 E Chestnut St Unit 17DF
- 201 E Chestnut St Unit 20CE
- 201 E Chestnut St Unit 4CE
- 201 E Chestnut St Unit 3A
- 201 E Chestnut St Unit 17B
- 201 E Chestnut St Unit 17C
- 201 E Chestnut St Unit 4A
- 201 E Chestnut St Unit 12E
- 201 E Chestnut St Unit 24E
- 201 E Chestnut St Unit 11A
- 201 E Chestnut St Unit 4CE
- 201 E Chestnut St Unit 4CE
- 201 E Chestnut St Unit 17D
- 201 E Chestnut St Unit 9B
- 201 E Chestnut St Unit 10B
- 201 E Chestnut St Unit 7C
- 201 E Chestnut St Unit 24F
- 201 E Chestnut St Unit 18E
Your Personal Tour Guide
Ask me questions while you tour the home.