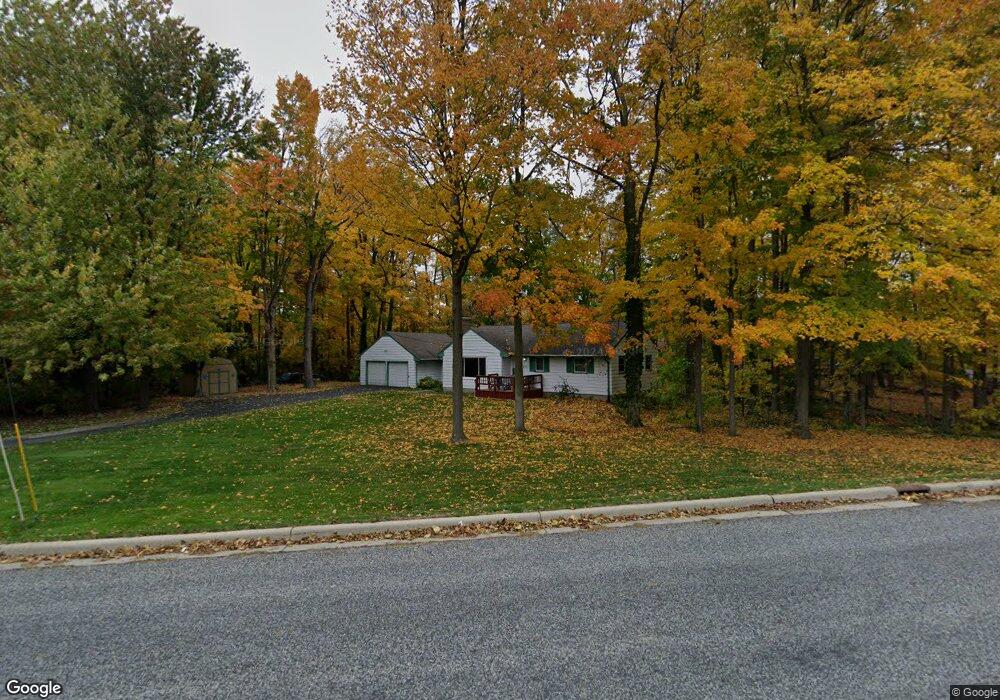
201 E Northrup St Lansing, MI 48911
Southern Lansing NeighborhoodEstimated Value: $182,260 - $232,000
3
Beds
2
Baths
2,224
Sq Ft
$93/Sq Ft
Est. Value
About This Home
This home is located at 201 E Northrup St, Lansing, MI 48911 and is currently estimated at $207,815, approximately $93 per square foot. 201 E Northrup St is a home located in Ingham County with nearby schools including Kendon School, Attwood School, and Everett High School.
Ownership History
Date
Name
Owned For
Owner Type
Purchase Details
Closed on
Jul 19, 2002
Sold by
Norton Lester J and Norton Delores G
Bought by
Flores David A
Current Estimated Value
Home Financials for this Owner
Home Financials are based on the most recent Mortgage that was taken out on this home.
Original Mortgage
$110,675
Outstanding Balance
$46,884
Interest Rate
6.7%
Mortgage Type
Purchase Money Mortgage
Estimated Equity
$160,931
Purchase Details
Closed on
Mar 1, 1995
Create a Home Valuation Report for This Property
The Home Valuation Report is an in-depth analysis detailing your home's value as well as a comparison with similar homes in the area
Home Values in the Area
Average Home Value in this Area
Purchase History
| Date | Buyer | Sale Price | Title Company |
|---|---|---|---|
| Flores David A | $116,500 | -- | |
| -- | $81,900 | -- |
Source: Public Records
Mortgage History
| Date | Status | Borrower | Loan Amount |
|---|---|---|---|
| Open | Flores David A | $110,675 |
Source: Public Records
Tax History
| Year | Tax Paid | Tax Assessment Tax Assessment Total Assessment is a certain percentage of the fair market value that is determined by local assessors to be the total taxable value of land and additions on the property. | Land | Improvement |
|---|---|---|---|---|
| 2025 | $3,667 | $95,100 | $15,400 | $79,700 |
| 2024 | $29 | $80,500 | $15,400 | $65,100 |
| 2023 | $3,438 | $73,000 | $15,400 | $57,600 |
| 2022 | $3,097 | $66,100 | $15,400 | $50,700 |
| 2021 | $3,033 | $62,000 | $12,900 | $49,100 |
| 2020 | $3,014 | $57,700 | $12,900 | $44,800 |
| 2019 | $2,891 | $52,600 | $12,900 | $39,700 |
| 2018 | $2,708 | $49,600 | $12,900 | $36,700 |
| 2017 | $2,593 | $49,600 | $12,900 | $36,700 |
| 2016 | $2,528 | $46,400 | $12,900 | $33,500 |
| 2015 | $2,528 | $45,000 | $25,842 | $19,158 |
| 2014 | $2,528 | $45,200 | $31,995 | $13,205 |
Source: Public Records
Map
Nearby Homes
- 208 E Northrup St
- 115 E Claremore Dr
- 5267 Crocus Ave
- 419 W Jolly Rd
- 5009 Kessler Dr
- 201 E Syringa Dr
- 5008 Southgate Ave
- 826 R G Curtiss Ave
- 6246 Gardenia Ave
- 111 E Potter Ave
- 221 W Everettdale Ave
- 4926 Burchfield Ave
- 4907 Burchfield Ave
- 1115 Shirley St
- 1015 Brad St
- 1109 Barr Ave
- 1020 R G Curtiss Ave
- 6429 Rosedale Rd
- 5641 Ashley Dr
- 0 W Jolly Rd
- 125 E Northrup St
- 228 Trinity Cir
- 226 Trinity Cir
- 5527 Mccourt St
- 122 E Northrup St
- 115 E Northrup St
- 5521 Mccourt St
- 221 E Northrup St
- 134 E Northrup St
- 5515 Mccourt St
- 132 E Northrup St Unit (132
- 132 E Northrup St
- 234 Trinity Cir
- 208 Redner St
- 5501 Mccourt St
- 301 E Northrup St
- 238 Trinity Cir
- 308 Redner St
Your Personal Tour Guide
Ask me questions while you tour the home.