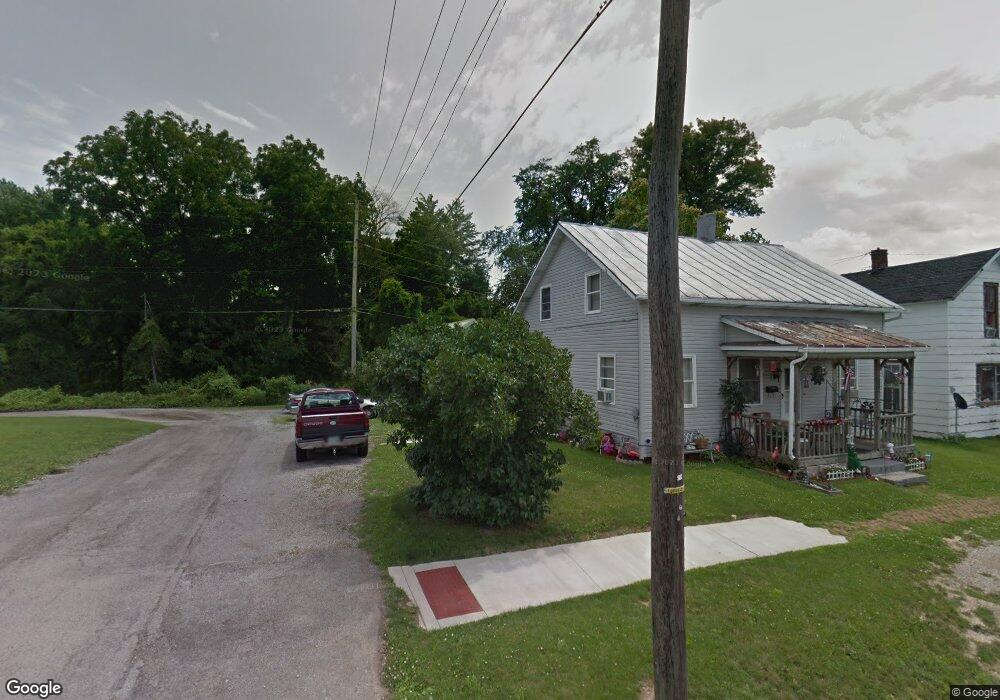
201 E Walnut St Kenton, OH 43326
Estimated Value: $84,000 - $150,000
1
Bed
1
Bath
576
Sq Ft
$186/Sq Ft
Est. Value
About This Home
This home is located at 201 E Walnut St, Kenton, OH 43326 and is currently estimated at $107,000, approximately $185 per square foot. 201 E Walnut St is a home located in Hardin County with nearby schools including Kenton Elementary School, Kenton Middle School, and Kenton High School.
Ownership History
Date
Name
Owned For
Owner Type
Purchase Details
Closed on
Oct 22, 2013
Sold by
Vermillion Lynda S and Curlis Lynda S
Bought by
Steve White Rentals Llc
Current Estimated Value
Home Financials for this Owner
Home Financials are based on the most recent Mortgage that was taken out on this home.
Original Mortgage
$120,000
Outstanding Balance
$61,899
Interest Rate
4.59%
Mortgage Type
Future Advance Clause Open End Mortgage
Estimated Equity
$45,101
Purchase Details
Closed on
Apr 28, 2005
Sold by
Burton Lisa Lynn and Richardson Lisa L
Bought by
Curlis William F and Curlis Lynda S
Home Financials for this Owner
Home Financials are based on the most recent Mortgage that was taken out on this home.
Original Mortgage
$33,000
Interest Rate
6.62%
Mortgage Type
Adjustable Rate Mortgage/ARM
Purchase Details
Closed on
Dec 18, 1992
Purchase Details
Closed on
Oct 7, 1991
Purchase Details
Closed on
Sep 12, 1986
Create a Home Valuation Report for This Property
The Home Valuation Report is an in-depth analysis detailing your home's value as well as a comparison with similar homes in the area
Home Values in the Area
Average Home Value in this Area
Purchase History
| Date | Buyer | Sale Price | Title Company |
|---|---|---|---|
| Steve White Rentals Llc | $122,000 | None Available | |
| Curlis William F | $15,000 | -- | |
| -- | -- | -- | |
| -- | $25,000 | -- | |
| -- | $13,000 | -- |
Source: Public Records
Mortgage History
| Date | Status | Borrower | Loan Amount |
|---|---|---|---|
| Open | Steve White Rentals Llc | $120,000 | |
| Previous Owner | Curlis William F | $33,000 |
Source: Public Records
Tax History
| Year | Tax Paid | Tax Assessment Tax Assessment Total Assessment is a certain percentage of the fair market value that is determined by local assessors to be the total taxable value of land and additions on the property. | Land | Improvement |
|---|---|---|---|---|
| 2024 | $1,241 | $27,560 | $1,310 | $26,250 |
| 2023 | $1,249 | $27,560 | $1,310 | $26,250 |
| 2022 | $923 | $18,930 | $1,140 | $17,790 |
| 2021 | $926 | $18,930 | $1,140 | $17,790 |
| 2020 | $810 | $18,930 | $1,140 | $17,790 |
| 2019 | $652 | $15,580 | $1,090 | $14,490 |
| 2015 | $600 | $16,220 | $1,510 | $14,710 |
| 2014 | $637 | $16,220 | $1,510 | $14,710 |
| 2013 | $754 | $18,640 | $1,510 | $17,130 |
Source: Public Records
Map
Nearby Homes
- 226 S Wayne St
- 121 S High St
- 354 S Barron St
- 508 Decatur St
- 530 E Franklin St
- 405 E Carroll St
- 405 E Carrol St Unit 405 1/2
- 215 N Main St
- 39 Grape St
- 219 W Carrol St
- 233 N Main St
- 639 S Main St
- 509 E North St
- 310 N Market St
- 79 Broadway St
- 820 King St
- 89 Broadway St
- 727 S Detroit St
- 0 N Barron St
- 920 Cooper St
Your Personal Tour Guide
Ask me questions while you tour the home.