201 Elm St Elgin, IL 60123
Near West Elgin NeighborhoodEstimated Value: $261,000 - $278,000
2
Beds
1
Bath
1,222
Sq Ft
$220/Sq Ft
Est. Value
About This Home
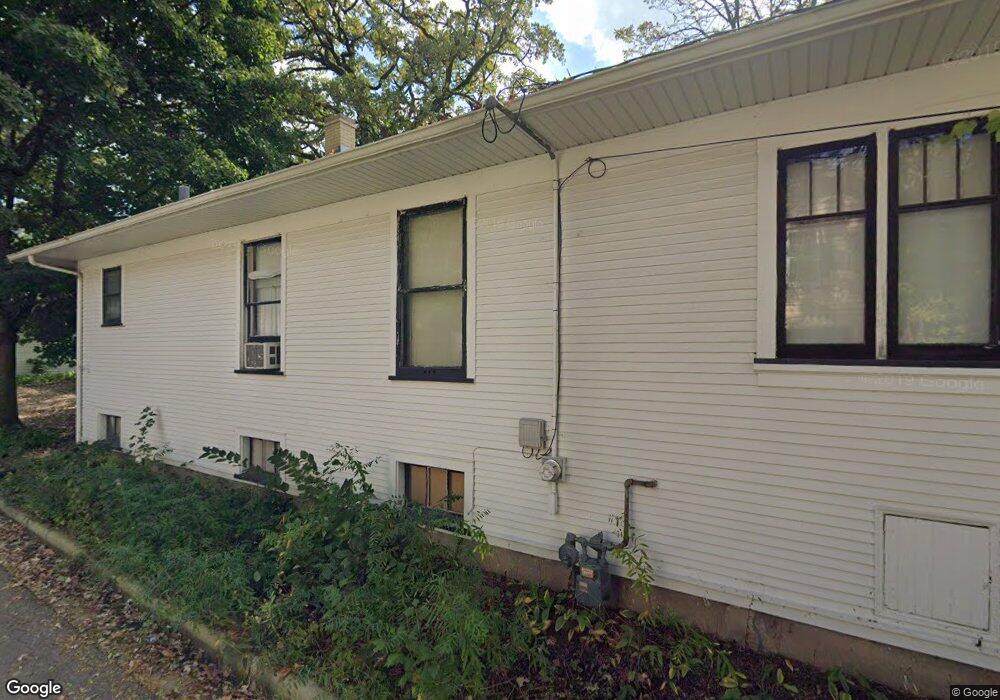
This home is located at 201 Elm St, Elgin, IL 60123 and is currently estimated at $268,935, approximately $220 per square foot. 201 Elm St is a home located in Kane County with nearby schools including Lowrie Elementary School, Abbott Middle School, and Larkin High School.
Ownership History
Date
Name
Owned For
Owner Type
Purchase Details
Closed on
Mar 30, 2022
Sold by
Jonson Christopher M
Bought by
Jonson Suzanne M
Current Estimated Value
Purchase Details
Closed on
Mar 10, 1997
Sold by
Scherf Billie E and Scherf Ruth M
Bought by
Jonson Christopher M and Jonson Suzann M
Home Financials for this Owner
Home Financials are based on the most recent Mortgage that was taken out on this home.
Original Mortgage
$103,988
Interest Rate
7.82%
Mortgage Type
FHA
Create a Home Valuation Report for This Property
The Home Valuation Report is an in-depth analysis detailing your home's value as well as a comparison with similar homes in the area
Home Values in the Area
Average Home Value in this Area
Purchase History
We collect this data history from publicly available records. To have your information removed, we recommend requesting removal directly through your county’s website.
| Date | Buyer | Sale Price | Title Company |
|---|---|---|---|
| Jonson Suzanne M | -- | Nudo Christopher S | |
| Jonson Christopher M | $105,500 | -- |
Source: Public Records
Mortgage History
We collect this data history from publicly available records. To have your information removed, we recommend requesting removal directly through your county’s website.
| Date | Status | Borrower | Loan Amount |
|---|---|---|---|
| Previous Owner | Jonson Christopher M | $103,988 |
Source: Public Records
Tax History
| Year | Tax Paid | Tax Assessment Tax Assessment Total Assessment is a certain percentage of the fair market value that is determined by local assessors to be the total taxable value of land and additions on the property. | Land | Improvement |
|---|---|---|---|---|
| 2024 | $5,170 | $72,605 | $15,683 | $56,922 |
| 2023 | $4,910 | $65,593 | $14,168 | $51,425 |
| 2022 | $4,666 | $59,810 | $12,919 | $46,891 |
| 2021 | $4,454 | $55,918 | $12,078 | $43,840 |
| 2020 | $4,321 | $53,382 | $11,530 | $41,852 |
| 2019 | $4,189 | $50,850 | $10,983 | $39,867 |
| 2018 | $4,032 | $46,683 | $10,347 | $36,336 |
| 2017 | $3,922 | $44,133 | $9,782 | $34,351 |
| 2016 | $3,727 | $40,943 | $9,075 | $31,868 |
| 2015 | -- | $37,528 | $8,318 | $29,210 |
| 2014 | -- | $37,064 | $8,215 | $28,849 |
| 2013 | -- | $38,042 | $8,432 | $29,610 |
Source: Public Records
Map
Nearby Homes
- 410 Standish St
- 208 Moseley St
- 515 Walnut Ave
- 311 Ryerson Ave
- 515 Oak St
- 141 S Grove Ave
- 147 River Walk Ct
- 153 Dawson Dr
- 168 Villa St
- 519 W Highland Ave
- 315 Vandalia St
- 14 Highland Ave
- 447 Ashland Ave
- 216 Wilcox Ave
- 164 Ludeka Place
- 726 W Highland Ave
- 286 Villa St
- 720 Adams St
- 835 Oak St
- 316 Lawrence Ave
Your Personal Tour Guide
Ask me questions while you tour the home.