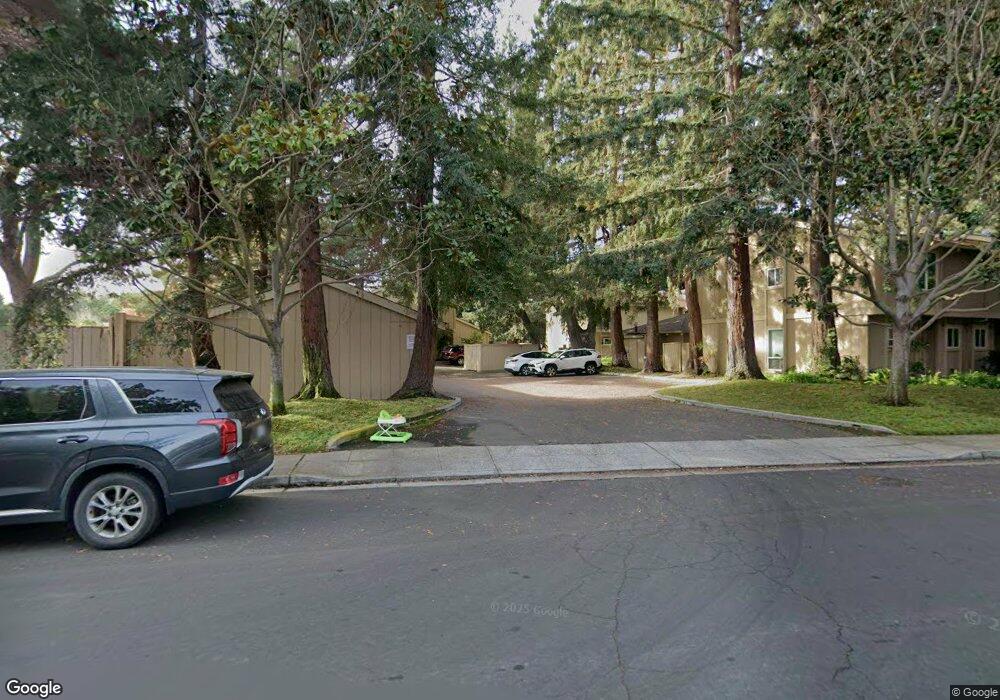
201 Flynn Ave Unit 3 Mountain View, CA 94043
Whisman NeighborhoodEstimated Value: $1,148,000 - $1,743,000
3
Beds
2
Baths
1,420
Sq Ft
$967/Sq Ft
Est. Value
About This Home
This home is located at 201 Flynn Ave Unit 3, Mountain View, CA 94043 and is currently estimated at $1,372,966, approximately $966 per square foot. 201 Flynn Ave Unit 3 is a home located in Santa Clara County with nearby schools including Amy Imai Elementary School, Crittenden Middle School, and Mountain View High School.
Ownership History
Date
Name
Owned For
Owner Type
Purchase Details
Closed on
Mar 14, 2022
Sold by
Sohini Solanki
Bought by
Sohini Solanki Family Trust
Current Estimated Value
Purchase Details
Closed on
Jan 28, 2020
Sold by
Solanki Pratik and Solanki Sohini
Bought by
Solanki Sohini
Purchase Details
Closed on
Dec 18, 2006
Sold by
Lane James W and Lane Marilyn A
Bought by
Solanki Pratik and Solanki Sohini
Home Financials for this Owner
Home Financials are based on the most recent Mortgage that was taken out on this home.
Original Mortgage
$92,400
Interest Rate
6.22%
Mortgage Type
Stand Alone Second
Purchase Details
Closed on
Mar 24, 1997
Sold by
Lane James W and Lane Marilyn A
Bought by
Lane James W and Lane Marilyn A
Create a Home Valuation Report for This Property
The Home Valuation Report is an in-depth analysis detailing your home's value as well as a comparison with similar homes in the area
Home Values in the Area
Average Home Value in this Area
Purchase History
| Date | Buyer | Sale Price | Title Company |
|---|---|---|---|
| Sohini Solanki Family Trust | -- | None Listed On Document | |
| Solanki Sohini | -- | None Available | |
| Solanki Pratik | -- | Old Republic Title Company | |
| Lane James W | -- | -- |
Source: Public Records
Mortgage History
| Date | Status | Borrower | Loan Amount |
|---|---|---|---|
| Previous Owner | Solanki Pratik | $92,400 | |
| Previous Owner | Solanki Pratik | $492,800 |
Source: Public Records
Tax History Compared to Growth
Tax History
| Year | Tax Paid | Tax Assessment Tax Assessment Total Assessment is a certain percentage of the fair market value that is determined by local assessors to be the total taxable value of land and additions on the property. | Land | Improvement |
|---|---|---|---|---|
| 2025 | $9,564 | $825,300 | $412,650 | $412,650 |
| 2024 | $9,564 | $809,118 | $404,559 | $404,559 |
| 2023 | $9,466 | $793,254 | $396,627 | $396,627 |
| 2022 | $9,439 | $777,700 | $388,850 | $388,850 |
| 2021 | $9,210 | $762,452 | $381,226 | $381,226 |
| 2020 | $9,221 | $754,634 | $377,317 | $377,317 |
| 2019 | $8,835 | $739,838 | $369,919 | $369,919 |
| 2018 | $8,745 | $725,332 | $362,666 | $362,666 |
| 2017 | $8,386 | $711,110 | $355,555 | $355,555 |
| 2016 | $8,121 | $697,168 | $348,584 | $348,584 |
| 2015 | $7,889 | $686,696 | $343,348 | $343,348 |
| 2014 | $7,817 | $673,246 | $336,623 | $336,623 |
Source: Public Records
Map
Nearby Homes
- 149 Flynn Ave
- 139 Flynn Ave
- 110 E Middlefield Rd Unit C
- 99 Sherland Ave Unit B
- 94 Flynn Ave Unit D
- 90 Flynn Ave Unit C
- 248 Walker Dr Unit 2
- 163 Gladys Ave
- 71 Gladys Ave
- 280 Easy St Unit 311
- 201 Ada Ave Unit 25
- 530 Devonshire Ct
- 175 Evandale Ave Unit 2
- 139 Easy St
- 3418 Pyramid Way
- 125 Orbit Way
- 118 Magnolia Ln
- 280 Orchard Ave Unit K
- 427 Nicholas Dr
- 268 Andsbury Ave
- 201 Flynn Ave Unit 2
- 201 Flynn Ave Unit 11
- 201 Flynn Ave Unit 10
- 201 Flynn Ave Unit 9
- 201 Flynn Ave Unit 8
- 201 Flynn Ave Unit 7
- 201 Flynn Ave Unit 6
- 201 Flynn Ave Unit 5
- 201 Flynn Ave Unit 4
- 201 Flynn Ave Unit 2
- 201 Flynn Ave Unit 1
- 201 Flynn Ave Unit 17
- 201 Flynn Ave Unit 18
- 201 Flynn Ave Unit 19
- 201 Flynn Ave Unit 20
- 201 Flynn Ave Unit 21
- 201 Flynn Ave Unit 16
- 201 Flynn Ave Unit 15
- 201 Flynn Ave Unit 14
- 201 Flynn Ave Unit 13