Baycrest 201 Harrison St Unit 1018 San Francisco, CA 94105
South Beach NeighborhoodEstimated Value: $418,607 - $537,000
--
Bed
1
Bath
427
Sq Ft
$1,090/Sq Ft
Est. Value
About This Home
This home is located at 201 Harrison St Unit 1018, San Francisco, CA 94105 and is currently estimated at $465,402, approximately $1,089 per square foot. 201 Harrison St Unit 1018 is a home located in San Francisco County with nearby schools including Daniel Webster Elementary School, James Lick Middle School, and Five Keys Charter School.
Ownership History
Date
Name
Owned For
Owner Type
Purchase Details
Closed on
Mar 7, 2005
Sold by
Cohn Jerry and Cohn Gloria L
Bought by
Lai Amy
Current Estimated Value
Home Financials for this Owner
Home Financials are based on the most recent Mortgage that was taken out on this home.
Original Mortgage
$261,450
Outstanding Balance
$133,776
Interest Rate
5.75%
Mortgage Type
Purchase Money Mortgage
Estimated Equity
$331,626
Purchase Details
Closed on
Oct 7, 2003
Sold by
Cohn Jerry and Cohn Gloria L
Bought by
Cohn Jerry and Cohn Gloria L
Purchase Details
Closed on
Nov 15, 2002
Sold by
Mulit David L and Mulit Cynthia J
Bought by
Cohn Jerry and Cohn Gloria L
Home Financials for this Owner
Home Financials are based on the most recent Mortgage that was taken out on this home.
Original Mortgage
$170,000
Interest Rate
5.12%
Create a Home Valuation Report for This Property
The Home Valuation Report is an in-depth analysis detailing your home's value as well as a comparison with similar homes in the area
Home Values in the Area
Average Home Value in this Area
Purchase History
| Date | Buyer | Sale Price | Title Company |
|---|---|---|---|
| Lai Amy | $373,500 | Fidelity National Title Co | |
| Cohn Jerry | -- | -- | |
| Cohn Jerry | $265,000 | Chicago Title Company |
Source: Public Records
Mortgage History
| Date | Status | Borrower | Loan Amount |
|---|---|---|---|
| Open | Lai Amy | $261,450 | |
| Previous Owner | Cohn Jerry | $170,000 | |
| Closed | Lai Amy | $74,700 |
Source: Public Records
Tax History Compared to Growth
Tax History
| Year | Tax Paid | Tax Assessment Tax Assessment Total Assessment is a certain percentage of the fair market value that is determined by local assessors to be the total taxable value of land and additions on the property. | Land | Improvement |
|---|---|---|---|---|
| 2025 | $6,781 | $520,596 | $260,298 | $260,298 |
| 2024 | $6,781 | $510,390 | $255,195 | $255,195 |
| 2023 | $6,667 | $500,384 | $250,192 | $250,192 |
| 2022 | $6,527 | $490,574 | $245,287 | $245,287 |
| 2021 | $6,408 | $480,956 | $240,478 | $240,478 |
| 2020 | $6,452 | $476,026 | $238,013 | $238,013 |
| 2019 | $6,235 | $466,694 | $233,347 | $233,347 |
| 2018 | $6,026 | $457,544 | $228,772 | $228,772 |
| 2017 | $5,657 | $448,574 | $224,287 | $224,287 |
| 2016 | $5,545 | $439,780 | $219,890 | $219,890 |
| 2015 | $5,475 | $433,176 | $216,588 | $216,588 |
| 2014 | $5,332 | $424,692 | $212,346 | $212,346 |
Source: Public Records
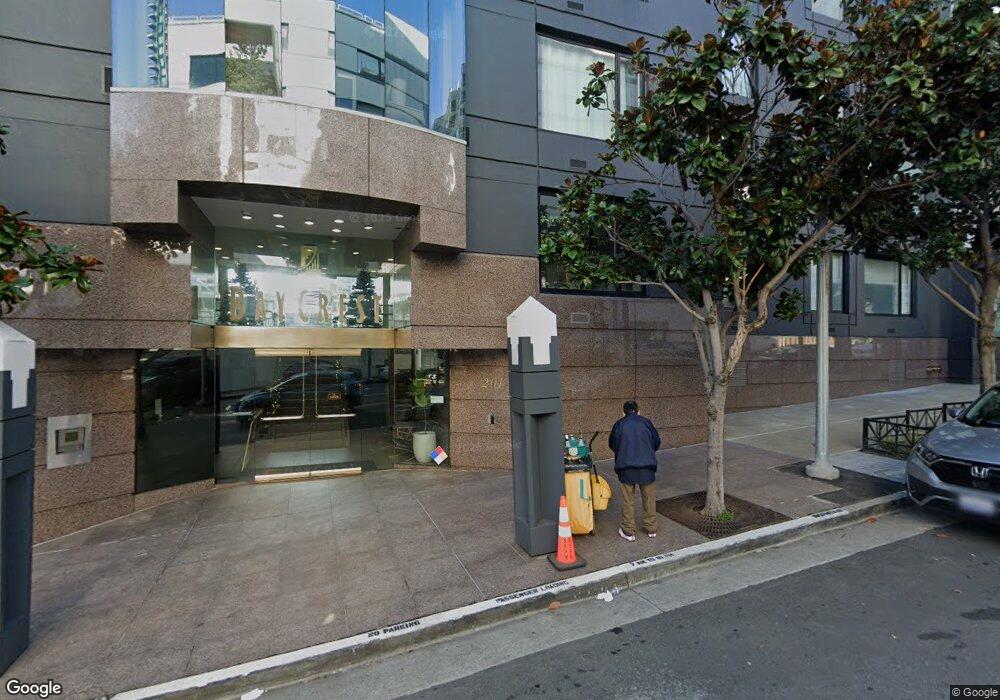
About Baycrest
Map
Nearby Homes
- 400 Beale St Unit 801
- 400 Beale St Unit 2006
- 400 Beale St Unit 1907
- 400 Beale St Unit 1102
- 400 Beale St Unit 905
- 400 Beale St Unit 403
- 38 Bryant St Unit 701
- 338 Main St Unit 27A
- 338 Main St Unit 26D
- 338 Main St Unit 30E
- 338 Main St Unit 7H
- 333 Main St Unit 8G
- 400 Spear St Unit 203
- 318 Main St Unit 5I
- 201 Folsom St Unit 2A
- 201 Folsom St Unit 33A
- 201 Folsom St Unit 38E
- 201 Folsom St Unit 12E
- 201 Folsom St Unit PH41C
- 501 Beale St Unit 10E
- 201 Harrison St
- 201 Harrison St Unit 304
- 201 Harrison St Unit 225
- 201 Harrison St
- 201 Harrison St Unit C-1
- 210 Harrison St Unit 225
- 201 Harrison St Unit 730
- 201 Harrison St Unit 630
- 201 Harrison St Unit 407
- 201 Harrison St Unit 201
- 201 Harrison St Unit 1025
- 201 Harrison St Unit 1024
- 201 Harrison St Unit 1023
- 201 Harrison St Unit 1022
- 201 Harrison St Unit 1021
- 201 Harrison St Unit 1020
- 201 Harrison St Unit 1019
- 201 Harrison St Unit 931
- 201 Harrison St Unit 930
- 201 Harrison St Unit 929