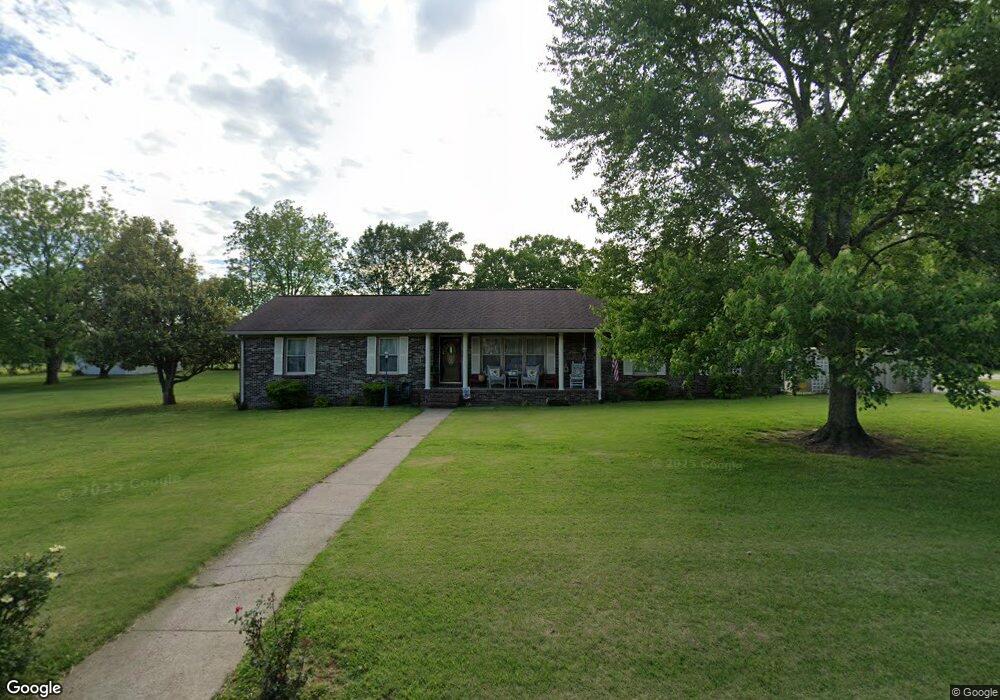
201 Idle Dr Shelbyville, TN 37160
Estimated Value: $331,000 - $349,000
--
Bed
2
Baths
1,491
Sq Ft
$229/Sq Ft
Est. Value
About This Home
This home is located at 201 Idle Dr, Shelbyville, TN 37160 and is currently estimated at $341,624, approximately $229 per square foot. 201 Idle Dr is a home located in Bedford County with nearby schools including Harris Middle School.
Ownership History
Date
Name
Owned For
Owner Type
Purchase Details
Closed on
Dec 16, 2024
Sold by
Flippo Steven and Flippo Cecelia
Bought by
Brannon James Donald and Brannon Deborah Faye
Current Estimated Value
Home Financials for this Owner
Home Financials are based on the most recent Mortgage that was taken out on this home.
Original Mortgage
$276,400
Outstanding Balance
$273,978
Interest Rate
6.79%
Mortgage Type
New Conventional
Estimated Equity
$67,646
Purchase Details
Closed on
Aug 8, 2016
Sold by
Lanny C
Bought by
Flippo Steven and Flippo Cecelia
Purchase Details
Closed on
Nov 20, 2000
Sold by
Walker William Baker
Bought by
Moore Lanny C and Moore Karen
Home Financials for this Owner
Home Financials are based on the most recent Mortgage that was taken out on this home.
Original Mortgage
$97,546
Interest Rate
7.82%
Purchase Details
Closed on
Sep 25, 1987
Bought by
Morris Kerry L and Morris Robin S
Purchase Details
Closed on
Jan 1, 1986
Bought by
Jones Travis
Create a Home Valuation Report for This Property
The Home Valuation Report is an in-depth analysis detailing your home's value as well as a comparison with similar homes in the area
Home Values in the Area
Average Home Value in this Area
Purchase History
| Date | Buyer | Sale Price | Title Company |
|---|---|---|---|
| Brannon James Donald | $345,500 | Lawyers Land & Title Services | |
| Flippo Steven | $160,000 | -- | |
| Moore Lanny C | $106,000 | -- | |
| Morris Kerry L | $72,000 | -- | |
| Jones Travis | $7,500 | -- |
Source: Public Records
Mortgage History
| Date | Status | Borrower | Loan Amount |
|---|---|---|---|
| Open | Brannon James Donald | $276,400 | |
| Previous Owner | Jones Travis | $97,546 |
Source: Public Records
Tax History Compared to Growth
Tax History
| Year | Tax Paid | Tax Assessment Tax Assessment Total Assessment is a certain percentage of the fair market value that is determined by local assessors to be the total taxable value of land and additions on the property. | Land | Improvement |
|---|---|---|---|---|
| 2025 | -- | $52,550 | $0 | $0 |
| 2024 | -- | $52,550 | $8,250 | $44,300 |
| 2023 | $2,000 | $52,550 | $8,250 | $44,300 |
| 2022 | $2,058 | $52,550 | $8,250 | $44,300 |
| 2021 | $1,869 | $52,550 | $8,250 | $44,300 |
| 2020 | $1,505 | $52,550 | $8,250 | $44,300 |
| 2019 | $1,505 | $33,975 | $5,475 | $28,500 |
| 2018 | $1,471 | $33,975 | $5,475 | $28,500 |
| 2017 | $1,471 | $33,975 | $5,475 | $28,500 |
| 2016 | $1,458 | $33,975 | $5,475 | $28,500 |
| 2015 | $1,458 | $33,975 | $5,475 | $28,500 |
| 2014 | $1,232 | $31,416 | $0 | $0 |
Source: Public Records
Map
Nearby Homes
- 216 Idle Dr
- 217 Idle Dr
- 227 Idle Dr
- 229 Idle Dr
- 215 Idle Dr
- 219 Idle Dr
- 221 Idle Dr
- 225 Idle Dr
- 222 Idle Dr
- 223 Idle Dr
- 301 Idle Dr
- Prelude Plan at Idle Reserve
- Wayfare Plan at Idle Reserve
- Venture Plan at Idle Reserve
- 106 Ledgeview Dr
- 307 Ledgeview Dr
- 807 Shoma Dr
- 11 Amos Smith Rd
- 108 Virginia Ct
- 149 Brown Ln