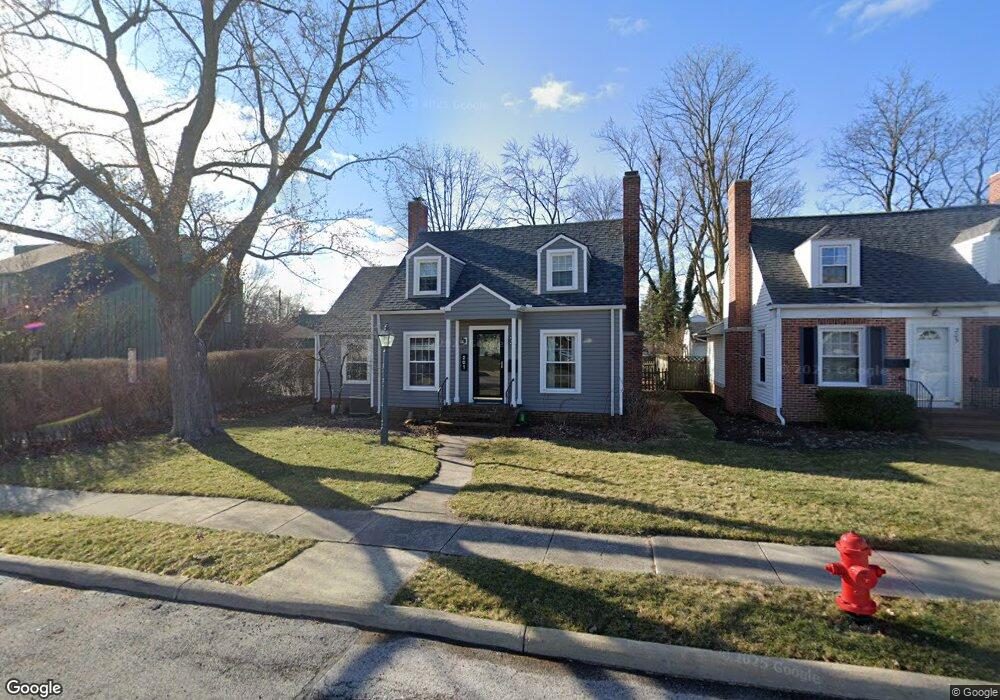
201 Lime St Findlay, OH 45840
Estimated Value: $229,032 - $265,000
3
Beds
2
Baths
1,996
Sq Ft
$126/Sq Ft
Est. Value
About This Home
This home is located at 201 Lime St, Findlay, OH 45840 and is currently estimated at $252,258, approximately $126 per square foot. 201 Lime St is a home located in Hancock County with nearby schools including Jefferson Elementary School, Chamberlin Hill Elementary School, and Donnell Middle School.
Ownership History
Date
Name
Owned For
Owner Type
Purchase Details
Closed on
Oct 18, 2016
Sold by
Annie E Gill
Bought by
Green Kristopher and Green Bethany
Current Estimated Value
Home Financials for this Owner
Home Financials are based on the most recent Mortgage that was taken out on this home.
Original Mortgage
$99,000
Outstanding Balance
$79,392
Interest Rate
3.47%
Estimated Equity
$172,866
Purchase Details
Closed on
Nov 29, 2007
Sold by
Skapura Michelle
Bought by
Gill Michael J and Gill Annie E
Home Financials for this Owner
Home Financials are based on the most recent Mortgage that was taken out on this home.
Original Mortgage
$135,000
Interest Rate
6.47%
Mortgage Type
New Conventional
Purchase Details
Closed on
Jul 2, 2007
Sold by
Skapura David
Bought by
Skapura Michelle
Purchase Details
Closed on
Dec 23, 1998
Sold by
Shrader James
Bought by
Skapura David and Skapura Michelle
Create a Home Valuation Report for This Property
The Home Valuation Report is an in-depth analysis detailing your home's value as well as a comparison with similar homes in the area
Home Values in the Area
Average Home Value in this Area
Purchase History
| Date | Buyer | Sale Price | Title Company |
|---|---|---|---|
| Green Kristopher | -- | -- | |
| Gill Michael J | $135,000 | Mid American Title Agency | |
| Skapura Michelle | -- | Attorney | |
| Skapura David | $125,000 | -- |
Source: Public Records
Mortgage History
| Date | Status | Borrower | Loan Amount |
|---|---|---|---|
| Open | Green Kristopher | $99,000 | |
| Closed | Green Kristopher | -- | |
| Previous Owner | Gill Michael J | $135,000 | |
| Closed | Skapura David | -- |
Source: Public Records
Tax History
| Year | Tax Paid | Tax Assessment Tax Assessment Total Assessment is a certain percentage of the fair market value that is determined by local assessors to be the total taxable value of land and additions on the property. | Land | Improvement |
|---|---|---|---|---|
| 2024 | $2,053 | $57,780 | $7,330 | $50,450 |
| 2023 | $2,056 | $57,780 | $7,330 | $50,450 |
| 2022 | $2,049 | $57,780 | $7,330 | $50,450 |
| 2021 | $2,110 | $51,850 | $7,500 | $44,350 |
| 2020 | $2,110 | $51,850 | $7,500 | $44,350 |
| 2019 | $2,068 | $51,850 | $7,500 | $44,350 |
| 2018 | $1,939 | $44,580 | $5,290 | $39,290 |
| 2017 | $969 | $44,580 | $5,290 | $39,290 |
| 2016 | $1,913 | $44,580 | $5,290 | $39,290 |
| 2015 | $1,397 | $31,960 | $3,030 | $28,930 |
| 2014 | $1,398 | $31,960 | $3,030 | $28,930 |
| 2012 | $1,410 | $31,960 | $3,030 | $28,930 |
Source: Public Records
Map
Nearby Homes
- 1206 S Main St
- 1200 S Main St
- 324 W Mcpherson Ave
- 1120 S West St
- 125 W Mcpherson Ave
- 1041 S Main St
- 206 Greenlawn Ave
- 313 2nd St
- 423 Elm St
- 835 S Main St
- 423 1st St
- 845 Hurd Ave
- 815 Liberty St
- 525 3rd St
- 829 Maple Ave
- 1215 S Blanchard St
- 400 E Pearl St
- 136 E Hobart Ave
- 514 Liberty St
- 209 E Hobart Ave
Your Personal Tour Guide
Ask me questions while you tour the home.