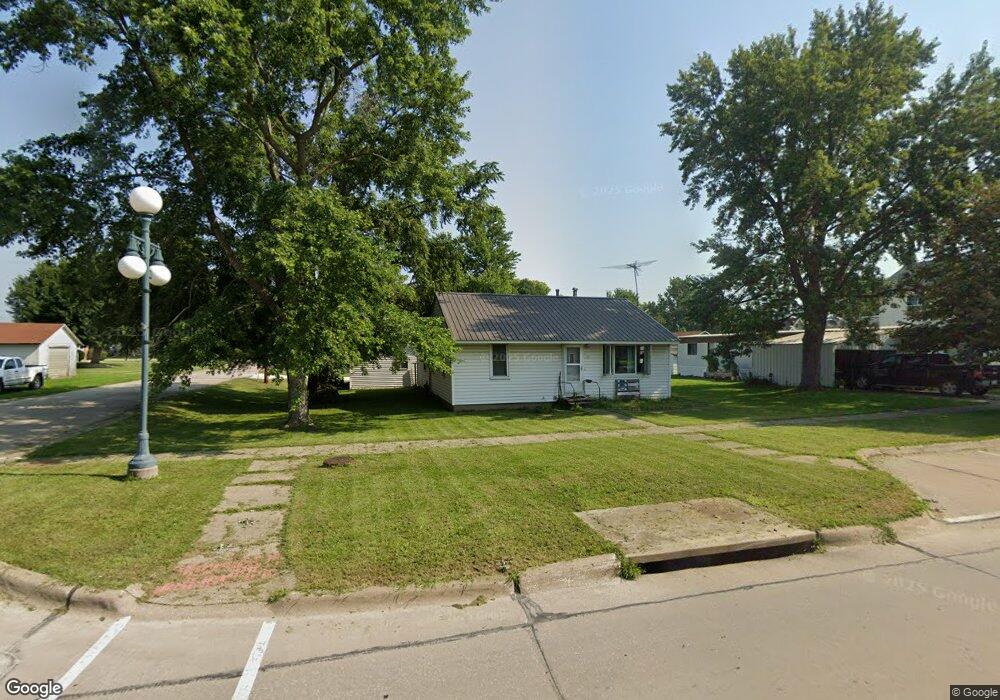
201 Main St Mediapolis, IA 52637
Estimated Value: $118,000 - $142,000
3
Beds
2
Baths
1,280
Sq Ft
$104/Sq Ft
Est. Value
About This Home
This home is located at 201 Main St, Mediapolis, IA 52637 and is currently estimated at $133,223, approximately $104 per square foot. 201 Main St is a home located in Des Moines County with nearby schools including Mediapolis Elementary School, Mediapolis Community Middle School, and Mediapolis High School.
Ownership History
Date
Name
Owned For
Owner Type
Purchase Details
Closed on
Jul 29, 2011
Sold by
Brown Gertrude
Bought by
Shelman Bruce O and Shelman Debora A
Current Estimated Value
Home Financials for this Owner
Home Financials are based on the most recent Mortgage that was taken out on this home.
Original Mortgage
$16,000
Interest Rate
4.52%
Mortgage Type
Future Advance Clause Open End Mortgage
Purchase Details
Closed on
Sep 19, 2008
Sold by
Shelman Bruce O and Shelman Debora A
Bought by
Shelman Bruce O and Shelman Debora A
Create a Home Valuation Report for This Property
The Home Valuation Report is an in-depth analysis detailing your home's value as well as a comparison with similar homes in the area
Home Values in the Area
Average Home Value in this Area
Purchase History
| Date | Buyer | Sale Price | Title Company |
|---|---|---|---|
| Shelman Bruce O | $20,000 | None Available | |
| Shelman Bruce O | -- | None Available |
Source: Public Records
Mortgage History
| Date | Status | Borrower | Loan Amount |
|---|---|---|---|
| Closed | Shelman Bruce O | $16,000 |
Source: Public Records
Tax History Compared to Growth
Tax History
| Year | Tax Paid | Tax Assessment Tax Assessment Total Assessment is a certain percentage of the fair market value that is determined by local assessors to be the total taxable value of land and additions on the property. | Land | Improvement |
|---|---|---|---|---|
| 2025 | $1,462 | $114,300 | $9,200 | $105,100 |
| 2024 | $1,462 | $100,800 | $9,200 | $91,600 |
| 2023 | $1,426 | $100,800 | $9,200 | $91,600 |
| 2022 | $1,374 | $84,900 | $9,200 | $75,700 |
| 2021 | $1,374 | $84,900 | $9,200 | $75,700 |
| 2020 | $1,438 | $84,900 | $9,200 | $75,700 |
| 2019 | $1,124 | $84,900 | $9,200 | $75,700 |
| 2018 | $1,102 | $71,100 | $7,100 | $64,000 |
| 2017 | $1,112 | $69,800 | $0 | $0 |
| 2016 | $1,082 | $69,800 | $0 | $0 |
| 2015 | $1,082 | $69,800 | $0 | $0 |
| 2014 | $1,092 | $65,900 | $0 | $0 |
Source: Public Records
Map
Nearby Homes
- 1012 Main St
- 1011 Middle St
- 205 Laci Dru
- 209 Laci Dru
- 201 Laci Dru
- 600 E Division St
- 310 S Church St
- 10361 155th St
- 208 E Division St
- 110 N Blair St
- 3556 Highway 99
- 13186 Cedar Hills Dr
- 12731 U S 61
- 1 155th St
- 10591 Rolling Hills Dr
- 10552 Rolling Hills Dr
- 11475 Plank Rd
- 9435 118th St
- 920 S 4th St
- 11161 Iroquois Rd