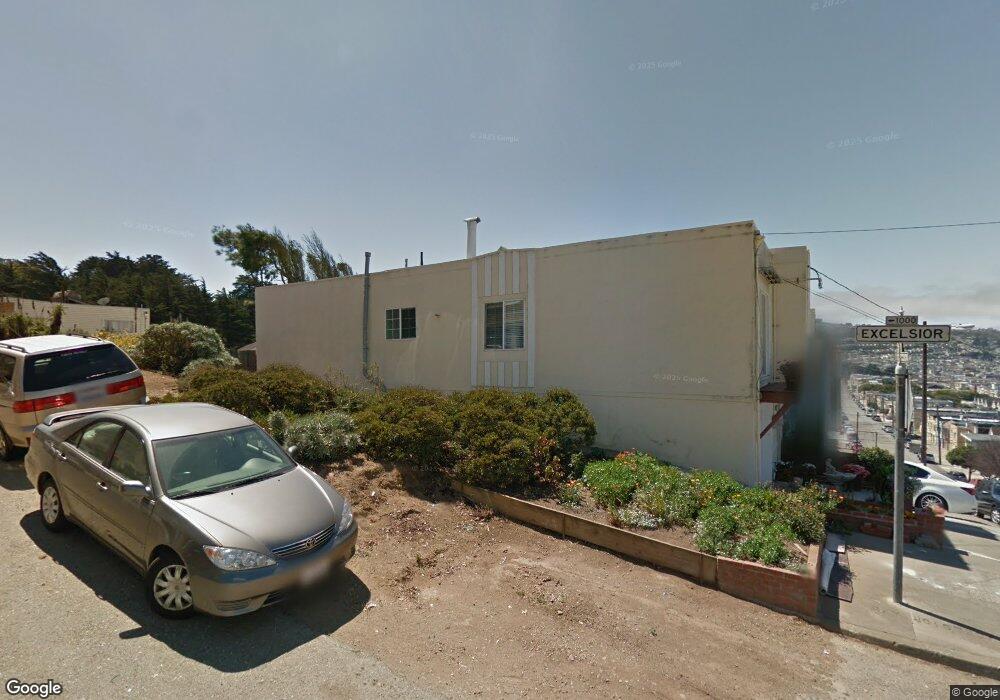
201 Munich St San Francisco, CA 94112
Excelsior NeighborhoodEstimated Value: $795,000 - $1,046,000
2
Beds
1
Bath
825
Sq Ft
$1,113/Sq Ft
Est. Value
About This Home
This home is located at 201 Munich St, San Francisco, CA 94112 and is currently estimated at $918,589, approximately $1,113 per square foot. 201 Munich St is a home located in San Francisco County with nearby schools including Cleveland Elementary School, Visitacion Valley Middle School, and Golden Bridges School.
Ownership History
Date
Name
Owned For
Owner Type
Purchase Details
Closed on
Aug 2, 1995
Sold by
Coast Federal Bank
Bought by
Arevalo Jose and Arevalo Maria I
Current Estimated Value
Home Financials for this Owner
Home Financials are based on the most recent Mortgage that was taken out on this home.
Original Mortgage
$134,500
Interest Rate
7.88%
Purchase Details
Closed on
Aug 15, 1994
Sold by
Coast Federal Bank and Arguello Rosa Lillian
Bought by
Coast Federal Bank
Create a Home Valuation Report for This Property
The Home Valuation Report is an in-depth analysis detailing your home's value as well as a comparison with similar homes in the area
Home Values in the Area
Average Home Value in this Area
Purchase History
| Date | Buyer | Sale Price | Title Company |
|---|---|---|---|
| Arevalo Jose | $152,500 | Fidelity National Title | |
| Coast Federal Bank | $200,000 | Fidelity National Title Co |
Source: Public Records
Mortgage History
| Date | Status | Borrower | Loan Amount |
|---|---|---|---|
| Closed | Arevalo Jose | $134,500 |
Source: Public Records
Tax History Compared to Growth
Tax History
| Year | Tax Paid | Tax Assessment Tax Assessment Total Assessment is a certain percentage of the fair market value that is determined by local assessors to be the total taxable value of land and additions on the property. | Land | Improvement |
|---|---|---|---|---|
| 2025 | $4,872 | $421,704 | $166,113 | $255,591 |
| 2024 | $4,872 | $413,437 | $162,856 | $250,581 |
| 2023 | $4,802 | $405,332 | $159,663 | $245,669 |
| 2022 | $4,717 | $397,387 | $156,533 | $240,854 |
| 2021 | $4,635 | $389,596 | $153,464 | $236,132 |
| 2020 | $4,648 | $385,603 | $151,891 | $233,712 |
| 2019 | $4,490 | $378,044 | $148,913 | $229,131 |
| 2018 | $4,340 | $370,634 | $145,994 | $224,640 |
| 2017 | $4,289 | $363,369 | $143,132 | $220,237 |
| 2016 | $4,197 | $356,246 | $140,326 | $215,920 |
| 2015 | $4,146 | $350,898 | $138,219 | $212,679 |
| 2014 | $4,296 | $344,027 | $135,512 | $208,515 |
Source: Public Records
Map
Nearby Homes