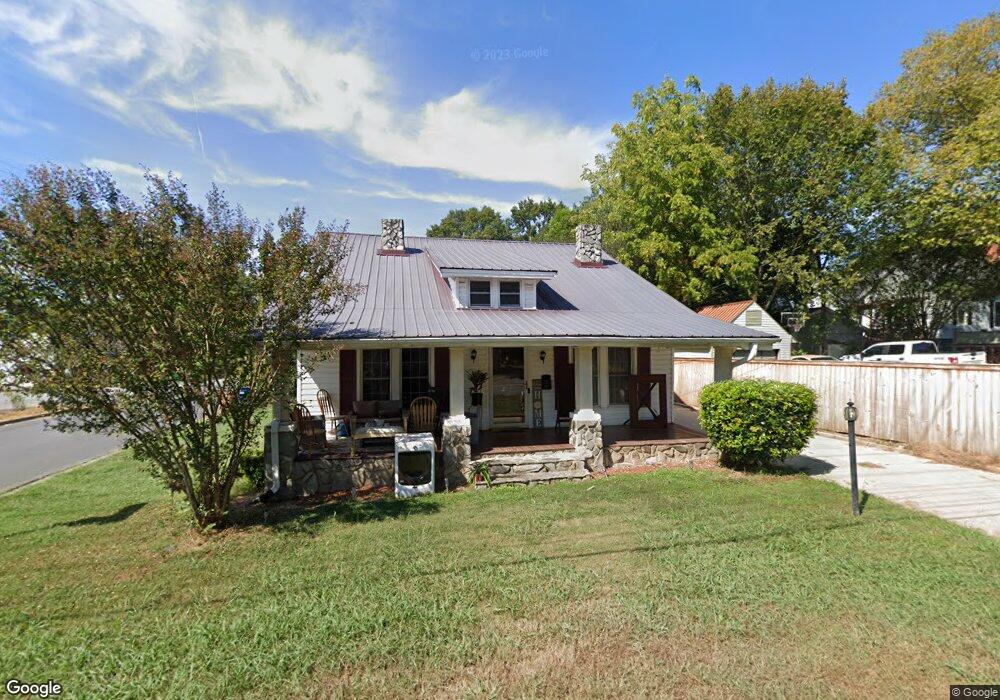
201 N Flint St Lincolnton, NC 28092
Estimated Value: $226,000 - $281,000
3
Beds
2
Baths
1,724
Sq Ft
$145/Sq Ft
Est. Value
About This Home
This home is located at 201 N Flint St, Lincolnton, NC 28092 and is currently estimated at $250,532, approximately $145 per square foot. 201 N Flint St is a home located in Lincoln County with nearby schools including Battleground Elementary School, Lincolnton Middle School, and Lincolnton High School.
Ownership History
Date
Name
Owned For
Owner Type
Purchase Details
Closed on
May 23, 2024
Sold by
Cook Properties Llc
Bought by
Cook Keith Phillip and Cook Crystal M
Current Estimated Value
Purchase Details
Closed on
Jul 13, 2016
Sold by
Cook Keith Phillip and Cook Crystal M
Bought by
Cook Properties Llc
Purchase Details
Closed on
Jul 31, 2009
Sold by
Southern Foothills Investors Inc
Bought by
Cook Keith Phillip
Purchase Details
Closed on
Mar 30, 2004
Bought by
Southern Foothills Investors Inc
Purchase Details
Closed on
Mar 2, 2004
Bought by
Lackey Jerry P
Purchase Details
Closed on
Jun 25, 2003
Bought by
Midfirst Bank
Purchase Details
Closed on
Feb 27, 2001
Bought by
Stewart Kennith F and Gwendolyn Darl
Purchase Details
Closed on
Sep 3, 1996
Bought by
Grooms Darin W and Grooms Dawn P
Create a Home Valuation Report for This Property
The Home Valuation Report is an in-depth analysis detailing your home's value as well as a comparison with similar homes in the area
Home Values in the Area
Average Home Value in this Area
Purchase History
| Date | Buyer | Sale Price | Title Company |
|---|---|---|---|
| Cook Keith Phillip | -- | None Listed On Document | |
| Cook Properties Llc | -- | None Available | |
| Cook Keith Phillip | $68,000 | None Available | |
| Southern Foothills Investors Inc | $69,000 | -- | |
| Lackey Jerry P | $69,000 | -- | |
| Midfirst Bank | $104,000 | -- | |
| Stewart Kennith F | $94,000 | -- | |
| Grooms Darin W | $17,000 | -- |
Source: Public Records
Tax History Compared to Growth
Tax History
| Year | Tax Paid | Tax Assessment Tax Assessment Total Assessment is a certain percentage of the fair market value that is determined by local assessors to be the total taxable value of land and additions on the property. | Land | Improvement |
|---|---|---|---|---|
| 2025 | $2,142 | $200,446 | $31,000 | $169,446 |
| 2024 | $2,122 | $200,446 | $31,000 | $169,446 |
| 2023 | $2,122 | $200,446 | $31,000 | $169,446 |
| 2022 | $1,165 | $89,022 | $16,680 | $72,342 |
| 2021 | $1,165 | $89,022 | $16,680 | $72,342 |
| 2020 | $1,032 | $89,022 | $16,680 | $72,342 |
| 2019 | $1,032 | $89,022 | $16,680 | $72,342 |
| 2018 | $955 | $72,940 | $15,100 | $57,840 |
| 2017 | $854 | $72,940 | $15,100 | $57,840 |
| 2016 | $854 | $72,940 | $15,100 | $57,840 |
| 2015 | $923 | $72,940 | $15,100 | $57,840 |
| 2014 | $964 | $76,093 | $16,000 | $60,093 |
Source: Public Records
Map
Nearby Homes
- 519 N State St
- 528 Sherrill Ave
- 110 W Pine St
- 826 E Alexander St
- 810 & 812 Lincoln St E Unit 810
- 4100 Summey Trail
- 326 S Cedar St
- 1024 Catawba St
- 815 N Laurel St
- 111 Newcastle Ave
- 316 N Government St
- 317 S High St
- 217 Rock Creek Dr
- 916 E Park Dr
- 00 Roper Dr
- 411 W Sycamore St
- 502 Forney Ave
- 130 Boulder Dr
- 208 Hollow Rd
- 524 Bonview Ave
- 619 E Sycamore St
- 202 N Flint St
- 628 E Pine St
- 206 N Flint St
- 210 N Flint St
- 709 E Sycamore St
- 616 E Pine St
- 216 N Flint St
- 713 E Sycamore St
- 609 E Sycamore St
- 710 E Pine St
- 612 E Pine St
- 719 E Sycamore St
- 00 Flint St
- 00 Flint St Unit 2
- 305 N Flint St
- 714 E Pine St
- 723 E Sycamore St
- 304 N Flint St
- 716 E Pine St