201 N Main St Rushville, IN 46173
--
Bed
--
Bath
8,547
Sq Ft
2,614
Sq Ft Lot
About This Home
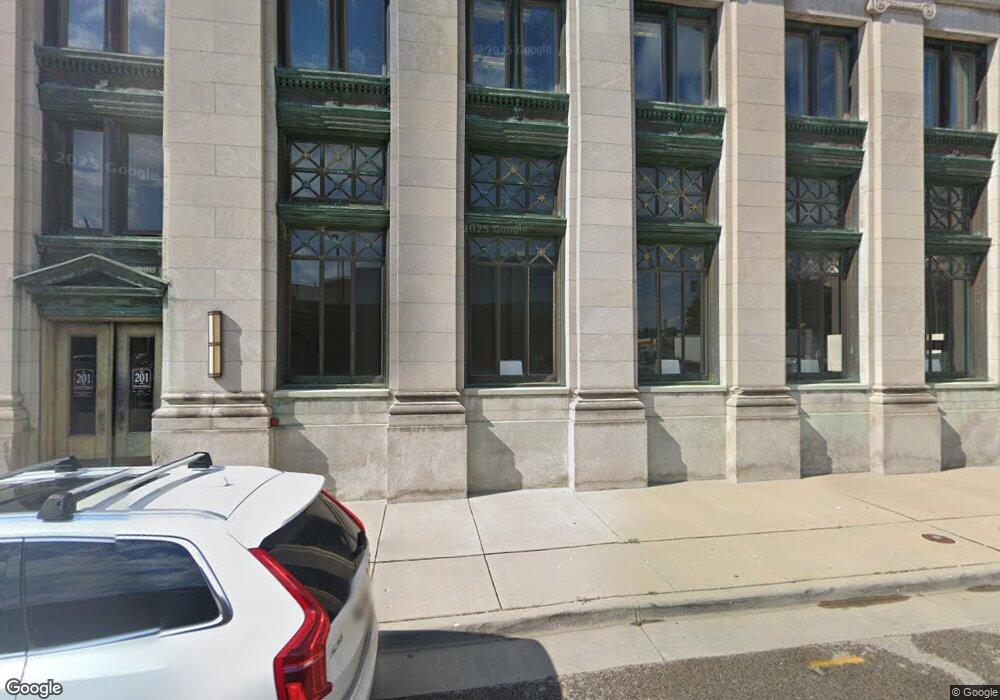
This home is located at 201 N Main St, Rushville, IN 46173. 201 N Main St is a home located in Rush County with nearby schools including Rushville Consolidated High School and St. Mary Catholic School.
Ownership History
Date
Name
Owned For
Owner Type
Purchase Details
Closed on
Dec 30, 2013
Sold by
Mandrell Family Lp Of Hancock County
Bought by
P And K Holdings Llc
Home Financials for this Owner
Home Financials are based on the most recent Mortgage that was taken out on this home.
Original Mortgage
$212,500
Outstanding Balance
$140,810
Interest Rate
4.38%
Mortgage Type
Future Advance Clause Open End Mortgage
Purchase Details
Closed on
Oct 11, 2006
Sold by
Lindauer Keith
Bought by
The Mandrell Family Lp
Purchase Details
Closed on
May 3, 2006
Sold by
Green Thomas and Green Toni J
Bought by
Mainsource Bank
Create a Home Valuation Report for This Property
The Home Valuation Report is an in-depth analysis detailing your home's value as well as a comparison with similar homes in the area
Home Values in the Area
Average Home Value in this Area
Purchase History
| Date | Buyer | Sale Price | Title Company |
|---|---|---|---|
| P And K Holdings Llc | -- | None Available | |
| The Mandrell Family Lp | -- | None Available | |
| Mainsource Bank | -- | None Available |
Source: Public Records
Mortgage History
| Date | Status | Borrower | Loan Amount |
|---|---|---|---|
| Open | P And K Holdings Llc | $212,500 |
Source: Public Records
Tax History Compared to Growth
Tax History
| Year | Tax Paid | Tax Assessment Tax Assessment Total Assessment is a certain percentage of the fair market value that is determined by local assessors to be the total taxable value of land and additions on the property. | Land | Improvement |
|---|---|---|---|---|
| 2024 | $7,188 | $239,600 | $3,000 | $236,600 |
| 2023 | $7,065 | $235,500 | $3,000 | $232,500 |
| 2022 | $7,065 | $235,500 | $3,000 | $232,500 |
| 2021 | $7,044 | $234,800 | $3,000 | $231,800 |
| 2020 | $7,044 | $234,800 | $3,000 | $231,800 |
| 2019 | $7,044 | $234,800 | $3,000 | $231,800 |
| 2018 | $7,059 | $235,300 | $3,000 | $232,300 |
| 2017 | $7,083 | $236,100 | $3,000 | $233,100 |
| 2016 | $7,083 | $236,100 | $3,000 | $233,100 |
| 2014 | $7,428 | $237,800 | $3,000 | $234,800 |
| 2013 | $7,428 | $176,900 | $16,000 | $160,900 |
Source: Public Records
Map
Nearby Homes