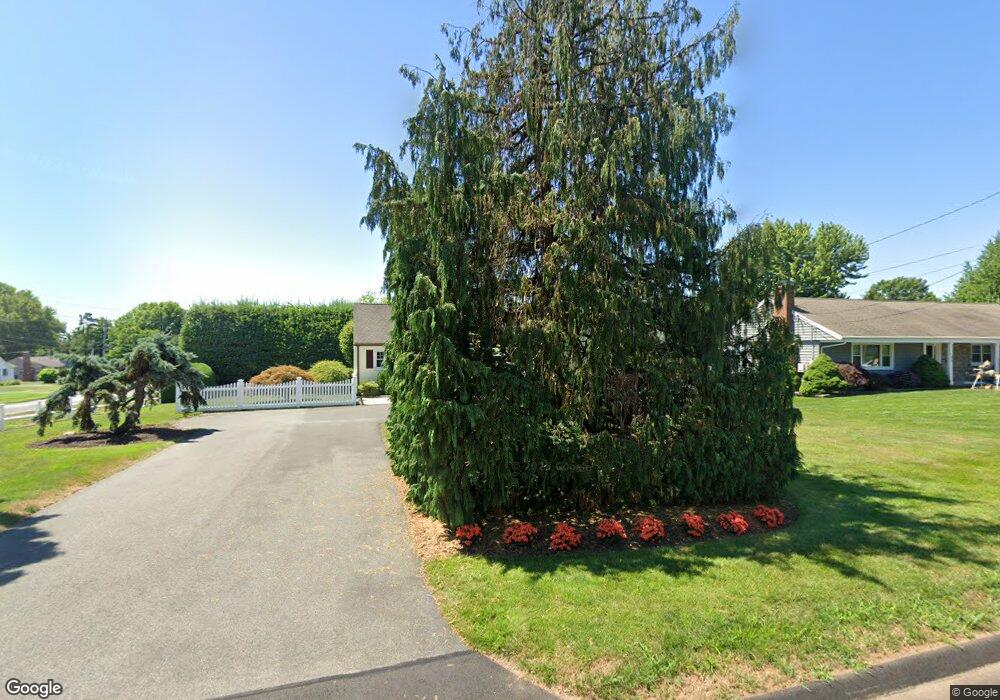
201 Ox Yoke Dr Wethersfield, CT 06109
Estimated Value: $375,000 - $416,000
3
Beds
2
Baths
1,221
Sq Ft
$326/Sq Ft
Est. Value
About This Home
This home is located at 201 Ox Yoke Dr, Wethersfield, CT 06109 and is currently estimated at $398,047, approximately $326 per square foot. 201 Ox Yoke Dr is a home located in Hartford County with nearby schools including Alfred W. Hanmer School, Woodcrest Elementary School, and Silas Deane Middle School.
Ownership History
Date
Name
Owned For
Owner Type
Purchase Details
Closed on
Jul 29, 1998
Sold by
Doyle James P Est
Bought by
Harding Charles E and Harding Margaret F
Current Estimated Value
Home Financials for this Owner
Home Financials are based on the most recent Mortgage that was taken out on this home.
Original Mortgage
$112,500
Interest Rate
6.92%
Mortgage Type
Unknown
Create a Home Valuation Report for This Property
The Home Valuation Report is an in-depth analysis detailing your home's value as well as a comparison with similar homes in the area
Home Values in the Area
Average Home Value in this Area
Purchase History
| Date | Buyer | Sale Price | Title Company |
|---|---|---|---|
| Harding Charles E | $125,000 | -- |
Source: Public Records
Mortgage History
| Date | Status | Borrower | Loan Amount |
|---|---|---|---|
| Open | Harding Charles E | $170,000 | |
| Closed | Harding Charles E | $100,000 | |
| Closed | Harding Charles E | $150,000 | |
| Closed | Harding Charles E | $112,500 |
Source: Public Records
Tax History Compared to Growth
Tax History
| Year | Tax Paid | Tax Assessment Tax Assessment Total Assessment is a certain percentage of the fair market value that is determined by local assessors to be the total taxable value of land and additions on the property. | Land | Improvement |
|---|---|---|---|---|
| 2025 | $9,831 | $238,500 | $99,320 | $139,180 |
| 2024 | $6,397 | $148,020 | $65,100 | $82,920 |
| 2023 | $6,184 | $148,020 | $65,100 | $82,920 |
| 2022 | $6,081 | $148,020 | $65,100 | $82,920 |
| 2021 | $6,020 | $148,020 | $65,100 | $82,920 |
| 2020 | $6,023 | $148,020 | $65,100 | $82,920 |
| 2019 | $6,030 | $148,020 | $65,100 | $82,920 |
| 2018 | $5,717 | $140,200 | $61,700 | $78,500 |
| 2017 | $5,576 | $140,200 | $61,700 | $78,500 |
| 2016 | $5,403 | $140,200 | $61,700 | $78,500 |
| 2015 | $5,354 | $140,200 | $61,700 | $78,500 |
| 2014 | $5,151 | $140,200 | $61,700 | $78,500 |
Source: Public Records
Map
Nearby Homes