Estimated Value: $393,000 - $401,000
3
Beds
2
Baths
1,244
Sq Ft
$318/Sq Ft
Est. Value
About This Home
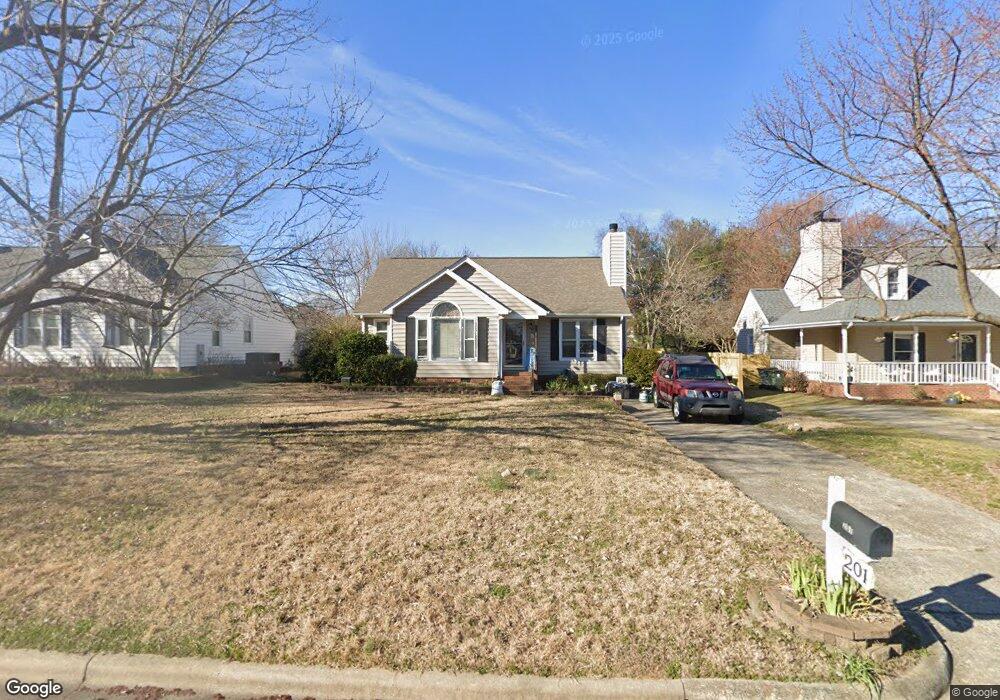
This home is located at 201 Perry Farms Dr, Apex, NC 27502 and is currently estimated at $396,024, approximately $318 per square foot. 201 Perry Farms Dr is a home located in Wake County with nearby schools including Apex Elementary School, Apex Middle, and Apex High School.
Ownership History
Date
Name
Owned For
Owner Type
Purchase Details
Closed on
Jul 18, 2008
Sold by
Galloway Nicholas B and Galloway Stacie B
Bought by
Wurst Claudine J
Current Estimated Value
Home Financials for this Owner
Home Financials are based on the most recent Mortgage that was taken out on this home.
Original Mortgage
$155,610
Outstanding Balance
$100,185
Interest Rate
6.03%
Mortgage Type
Purchase Money Mortgage
Estimated Equity
$295,839
Purchase Details
Closed on
Sep 21, 2004
Sold by
Bloomer Kinya S and Bloomer Daniel S
Bought by
Galloway Nicholas B and Galloway Stacie B
Home Financials for this Owner
Home Financials are based on the most recent Mortgage that was taken out on this home.
Original Mortgage
$113,600
Interest Rate
5.37%
Mortgage Type
Purchase Money Mortgage
Purchase Details
Closed on
Jun 21, 2002
Sold by
Broussard Howard C and Broussard Stacy A
Bought by
Bloomer Daniel S and Slover Kinya M
Home Financials for this Owner
Home Financials are based on the most recent Mortgage that was taken out on this home.
Original Mortgage
$121,100
Interest Rate
6.5%
Create a Home Valuation Report for This Property
The Home Valuation Report is an in-depth analysis detailing your home's value as well as a comparison with similar homes in the area
Home Values in the Area
Average Home Value in this Area
Purchase History
| Date | Buyer | Sale Price | Title Company |
|---|---|---|---|
| Wurst Claudine J | $164,000 | None Available | |
| Galloway Nicholas B | $142,000 | -- | |
| Bloomer Daniel S | $127,500 | -- |
Source: Public Records
Mortgage History
| Date | Status | Borrower | Loan Amount |
|---|---|---|---|
| Open | Wurst Claudine J | $155,610 | |
| Previous Owner | Galloway Nicholas B | $113,600 | |
| Previous Owner | Bloomer Daniel S | $121,100 | |
| Closed | Galloway Nicholas B | $28,400 |
Source: Public Records
Tax History Compared to Growth
Tax History
| Year | Tax Paid | Tax Assessment Tax Assessment Total Assessment is a certain percentage of the fair market value that is determined by local assessors to be the total taxable value of land and additions on the property. | Land | Improvement |
|---|---|---|---|---|
| 2025 | $3,242 | $369,009 | $190,000 | $179,009 |
| 2024 | $3,169 | $369,009 | $190,000 | $179,009 |
| 2023 | $2,334 | $210,956 | $77,000 | $133,956 |
| 2022 | $2,192 | $210,956 | $77,000 | $133,956 |
| 2021 | $2,108 | $210,956 | $77,000 | $133,956 |
| 2020 | $2,087 | $210,956 | $77,000 | $133,956 |
| 2019 | $1,879 | $163,686 | $65,000 | $98,686 |
| 2018 | $1,770 | $163,686 | $65,000 | $98,686 |
| 2017 | $1,649 | $163,686 | $65,000 | $98,686 |
| 2016 | $1,625 | $163,686 | $65,000 | $98,686 |
| 2015 | $1,523 | $149,666 | $52,000 | $97,666 |
| 2014 | -- | $149,666 | $52,000 | $97,666 |
Source: Public Records
Map
Nearby Homes
- 318 Glaston Ct
- 307 S Elm St
- 406 S Salem St
- 105 Cunningham St
- 1434 Salem Creek Dr
- 1039 Dual Parks Rd
- 410 2nd St
- 0-2932 Tingen Rd
- 311 Culvert St
- 309 Culvert St
- 1614 Brussels Dr
- 202 W Chatham St
- 1713 Yateley Ln
- 335 Anterbury Dr
- 359 Anterbury Dr
- 281 Williams Grove Ln Unit Lot 64
- 281 Williams Grove Ln
- 273 Williams Grove Ln Unit Lot 62
- 285 Williams Grove Ln Unit Lot 65
- 1464 Padstone Dr
- 203 Perry Farms Dr
- 205 Perry Farms Dr
- 107 Perry Farms Dr
- 808 Napleton Cir
- 106 Cordell Place
- 108 Cordell Place
- 806 Napleton Cir
- 207 Perry Farms Dr
- 105 Perry Farms Dr
- 202 Perry Farms Dr
- 108 Perry Farms Dr
- 104 Cordell Place
- 810 Napleton Cir
- 804 Napleton Cir
- 209 Perry Farms Dr
- 103 Perry Farms Dr
- 102 Cordell Place
- 206 Perry Farms Dr
- 104 Perry Farms Dr
- 802 Napleton Cir