Estimated Value: $502,000 - $545,734
3
Beds
3
Baths
1,562
Sq Ft
$330/Sq Ft
Est. Value
About This Home
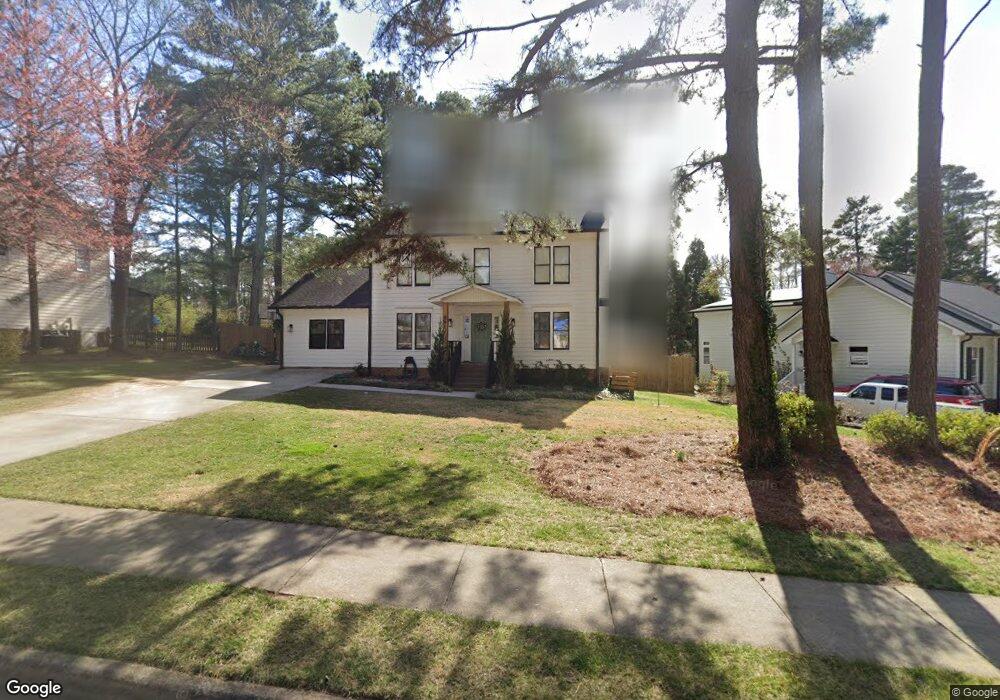
This home is located at 201 Pinewood Dr, Apex, NC 27502 and is currently estimated at $515,934, approximately $330 per square foot. 201 Pinewood Dr is a home located in Wake County with nearby schools including Apex Elementary School, Apex Middle, and Apex High School.
Ownership History
Date
Name
Owned For
Owner Type
Purchase Details
Closed on
May 6, 2019
Sold by
Pretty Furney
Bought by
Gaffney Tyler Adison and Gaffney Whitney Louise
Current Estimated Value
Home Financials for this Owner
Home Financials are based on the most recent Mortgage that was taken out on this home.
Original Mortgage
$280,330
Outstanding Balance
$245,460
Interest Rate
4%
Mortgage Type
New Conventional
Estimated Equity
$270,474
Purchase Details
Closed on
Jun 13, 2003
Sold by
Mcgehee Steven J and Mcgehee Jennifer J
Bought by
Pretty Furney
Home Financials for this Owner
Home Financials are based on the most recent Mortgage that was taken out on this home.
Original Mortgage
$122,800
Interest Rate
5.68%
Mortgage Type
Purchase Money Mortgage
Create a Home Valuation Report for This Property
The Home Valuation Report is an in-depth analysis detailing your home's value as well as a comparison with similar homes in the area
Home Values in the Area
Average Home Value in this Area
Purchase History
| Date | Buyer | Sale Price | Title Company |
|---|---|---|---|
| Gaffney Tyler Adison | $289,000 | None Available | |
| Pretty Furney | $153,500 | -- |
Source: Public Records
Mortgage History
| Date | Status | Borrower | Loan Amount |
|---|---|---|---|
| Open | Gaffney Tyler Adison | $280,330 | |
| Previous Owner | Pretty Furney | $122,800 |
Source: Public Records
Tax History Compared to Growth
Tax History
| Year | Tax Paid | Tax Assessment Tax Assessment Total Assessment is a certain percentage of the fair market value that is determined by local assessors to be the total taxable value of land and additions on the property. | Land | Improvement |
|---|---|---|---|---|
| 2025 | $4,367 | $497,913 | $190,000 | $307,913 |
| 2024 | $4,198 | $489,528 | $190,000 | $299,528 |
| 2023 | $3,238 | $293,300 | $75,000 | $218,300 |
| 2022 | $2,982 | $287,724 | $75,000 | $212,724 |
| 2021 | $2,868 | $287,724 | $75,000 | $212,724 |
| 2020 | $2,840 | $287,724 | $75,000 | $212,724 |
| 2019 | $2,611 | $228,107 | $75,000 | $153,107 |
| 2018 | $2,459 | $228,107 | $75,000 | $153,107 |
| 2017 | $2,290 | $228,107 | $75,000 | $153,107 |
| 2016 | $2,257 | $228,107 | $75,000 | $153,107 |
| 2015 | $1,926 | $189,747 | $58,000 | $131,747 |
| 2014 | -- | $189,747 | $58,000 | $131,747 |
Source: Public Records
Map
Nearby Homes
- 903 Norwood Ln
- 996 Tender Dr
- 1000 Oakgate Ct
- 1115 Platform Dr
- 1002 Eastham Dr
- 1111 Platform Dr
- 4006 New Yarmouth Way
- 953 Ambergate Station
- 596 Grand Central Station
- 919 Branch Line Ln
- 1003 Lathrop Ln
- 547 Grand Central Station
- 810 Richmont Grove Ln
- 904 Dalton Ridge Place
- 1808 N Salem St
- 635 Sawcut Ln
- 631 Sawcut Ln
- 633 Sawcut Ln
- 1106 Wellstone Cir
- 958 Bay Bouquet Ln
- 105 Pinewood Dr
- 203 Pinewood Dr
- 1003 Charred Oak Cir
- 1001 Fair Oaks Ln
- 202 Pinewood Dr
- 103 Pinewood Dr
- 1005 Charred Oak Cir
- 1000 Charred Oak Cir
- 1000 Fair Oaks Ln
- 1004 Charred Oak Cir
- 204 Pinewood Dr
- 1006 Charred Oak Cir
- 1003 Fair Oaks Ln
- 1002 Charred Oak Cir
- 1007 Charred Oak Cir
- 1008 Charred Oak Cir
- 300 Pinewood Dr
- 303 Pinewood Dr
- 1107 Laura Duncan Rd
- 1111 Laura Duncan Rd