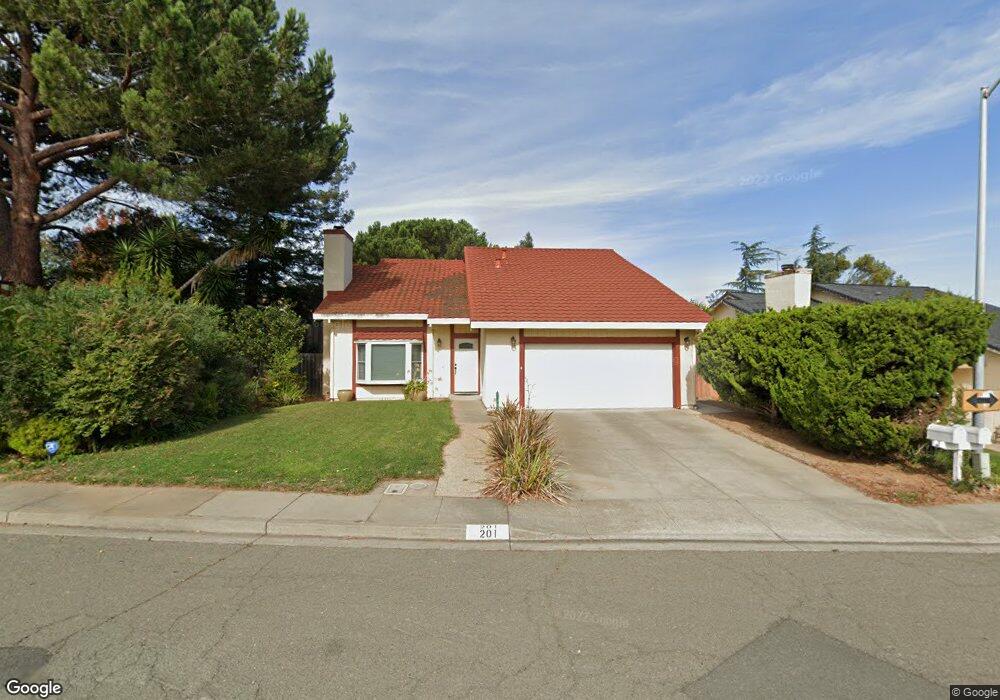
201 Redbud Ln Vallejo, CA 94591
Glen Cove NeighborhoodEstimated Value: $309,000 - $634,000
4
Beds
3
Baths
1,692
Sq Ft
$323/Sq Ft
Est. Value
About This Home
This home is located at 201 Redbud Ln, Vallejo, CA 94591 and is currently estimated at $546,400, approximately $322 per square foot. 201 Redbud Ln is a home located in Solano County with nearby schools including Glen Cove Elementary, Jesse M. Bethel High School, and Vallejo Charter School.
Ownership History
Date
Name
Owned For
Owner Type
Purchase Details
Closed on
Aug 5, 2015
Sold by
Pizzuto Anthony Gary
Bought by
Pizzuto Anthony Gary
Current Estimated Value
Home Financials for this Owner
Home Financials are based on the most recent Mortgage that was taken out on this home.
Original Mortgage
$33,740
Interest Rate
3.89%
Mortgage Type
Credit Line Revolving
Purchase Details
Closed on
Sep 5, 2008
Sold by
Pizzuto Anthony G
Bought by
Pizzuto Anthony Gary
Purchase Details
Closed on
Jan 10, 2001
Sold by
Pizzuto Karen M
Bought by
Pizzuto Anthony G
Home Financials for this Owner
Home Financials are based on the most recent Mortgage that was taken out on this home.
Original Mortgage
$220,000
Interest Rate
7.41%
Create a Home Valuation Report for This Property
The Home Valuation Report is an in-depth analysis detailing your home's value as well as a comparison with similar homes in the area
Home Values in the Area
Average Home Value in this Area
Purchase History
| Date | Buyer | Sale Price | Title Company |
|---|---|---|---|
| Pizzuto Anthony Gary | -- | Placer Title Company | |
| Pizzuto Anthony Gary | -- | None Available | |
| Pizzuto Anthony G | -- | Frontier Title |
Source: Public Records
Mortgage History
| Date | Status | Borrower | Loan Amount |
|---|---|---|---|
| Closed | Pizzuto Anthony Gary | $33,740 | |
| Closed | Pizzuto Anthony G | $220,000 |
Source: Public Records
Tax History
| Year | Tax Paid | Tax Assessment Tax Assessment Total Assessment is a certain percentage of the fair market value that is determined by local assessors to be the total taxable value of land and additions on the property. | Land | Improvement |
|---|---|---|---|---|
| 2025 | $4,289 | $250,917 | $59,737 | $191,180 |
| 2024 | $4,289 | $245,998 | $58,566 | $187,432 |
| 2023 | $4,042 | $241,175 | $57,418 | $183,757 |
| 2022 | $3,933 | $236,447 | $56,293 | $180,154 |
| 2021 | $3,845 | $231,812 | $55,190 | $176,622 |
| 2020 | $3,848 | $229,436 | $54,625 | $174,811 |
| 2019 | $3,727 | $224,938 | $53,554 | $171,384 |
| 2018 | $3,501 | $220,528 | $52,504 | $168,024 |
| 2017 | $3,347 | $216,205 | $51,475 | $164,730 |
| 2016 | $2,789 | $211,966 | $50,466 | $161,500 |
| 2015 | $2,750 | $208,783 | $49,708 | $159,075 |
| 2014 | $2,708 | $204,694 | $48,735 | $155,959 |
Source: Public Records
Map
Nearby Homes
- 256 Honeydew Dr
- 180 Winter Harbor Place
- 257 Valley Oak Ln
- 1259 Fulton Ave
- 293 Saybrook Way
- 181 Crowsnest Ct
- 1000 Topsail Dr
- 199 Mariner Dr
- 100 Bear Cove Ct
- 1207 1 2 Warren Ave
- 118 Hydrangea Ct
- 108 Sunnyglen Dr
- 1146 Lewis Ave
- 436 Gillcrest Ave
- 1161 Benicia Rd Unit 11
- 1161 Benicia Rd Unit 21
- 1161 Benicia Rd Unit SPC 18
- 157 James River Rd
- 709 Pope Dr
- 452 Wilshire Ave
- 111 Redbud Ln
- 480 Robles Way
- 488 Robles Way
- 321 Bluebell Place
- 311 Bluebell Place
- 472 Robles Way
- 301 Redbud Ln
- 100 Silverpine Ln
- 464 Robles Way
- 401 Bluebell Place
- 251 Bluebell Place
- 500 Robles Way
- 210 Redbud Ln
- 108 Silverpine Ln
- 456 Robles Way
- 109 Silverpine Ln
- 479 Robles Way
- 411 Bluebell Place
- 241 Bluebell Place
Your Personal Tour Guide
Ask me questions while you tour the home.