
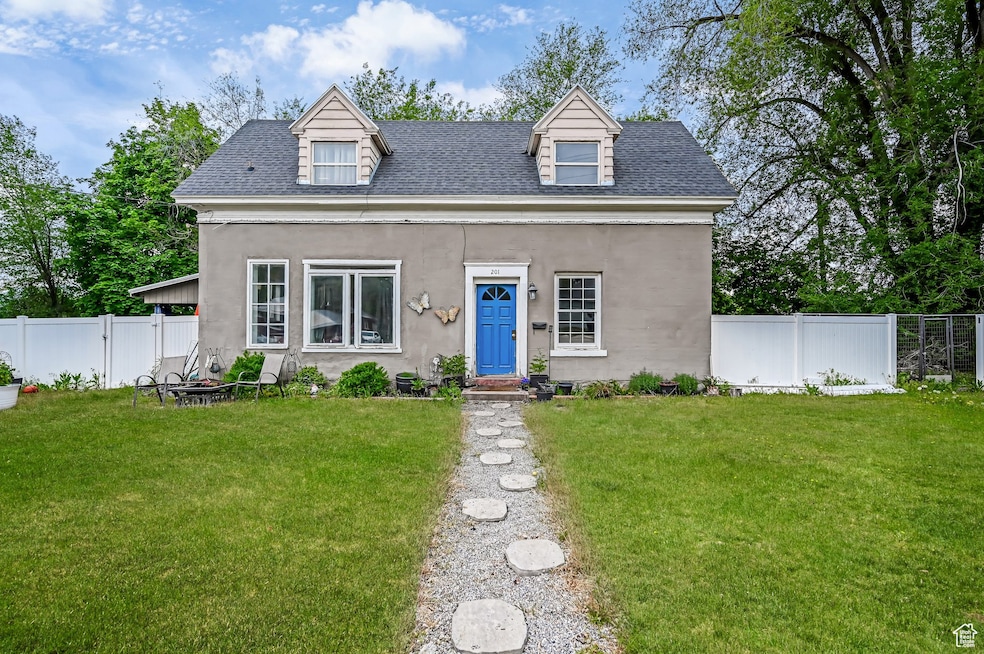

201 S 400 W Logan, UT 84321
Woodruff NeighborhoodEstimated payment $2,000/month
Total Views
7,687
3
Beds
2
Baths
1,693
Sq Ft
$201
Price per Sq Ft
Highlights
- Mature Trees
- Vaulted Ceiling
- Great Room
- Secluded Lot
- Wood Flooring
- No HOA
About This Home
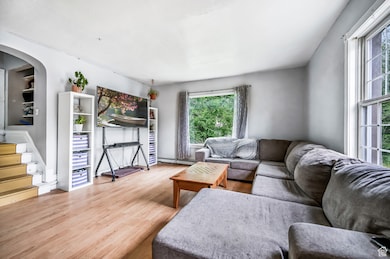
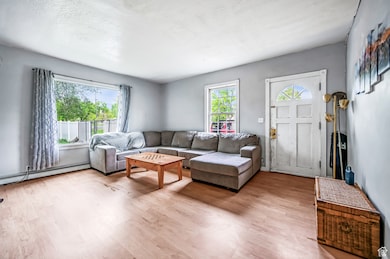
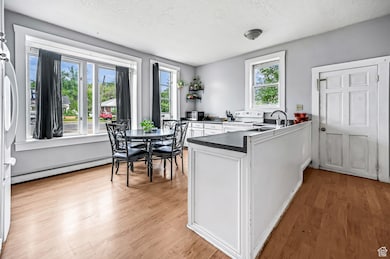
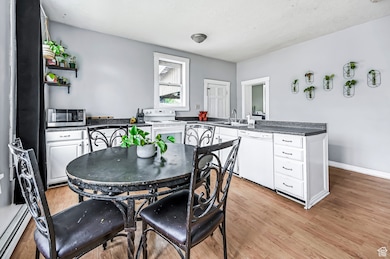
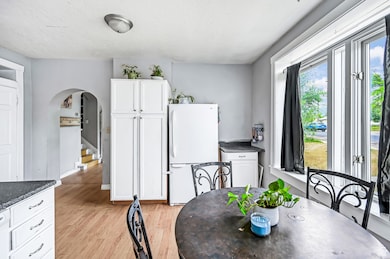
Surprisingly spacious for its era, this home offers an exceptional amount of room rarely found in properties of its time. The main level features a generously sized primary bedroom with an en-suite bathroom, a large kitchen, and a bright, inviting living room. Oversized windows throughout the home flood every room with natural light, creating a warm and airy atmosphere. Step outside into the vinyl-fenced corner lot-an ideal canvas to design your perfect outdoor lifestyle. Whether you're dreaming of a garden, entertaining space, or a peaceful retreat, the yard offers endless possibilities. This home is full of potential for personalized updates, giving you the opportunity to build equity and make it truly your own. Come see everything this charming property has to offer! Buyer and buyers agent to verify any and all information.
Listing Agent
Berkshire Hathaway Home Services Utah Properties (Cache Valley) License #12187365 Listed on: 05/21/2025
Home Details
Home Type
- Single Family
Est. Annual Taxes
- $1,350
Year Built
- Built in 1897
Lot Details
- 0.28 Acre Lot
- Property is Fully Fenced
- Secluded Lot
- Corner Lot
- Mature Trees
- Vegetable Garden
- Property is zoned Single-Family
Home Design
- Stucco
Interior Spaces
- 1,693 Sq Ft Home
- 3-Story Property
- Vaulted Ceiling
- Ceiling Fan
- Skylights
- Double Pane Windows
- Great Room
- Gas Dryer Hookup
Kitchen
- Microwave
- Portable Dishwasher
Flooring
- Wood
- Carpet
- Laminate
Bedrooms and Bathrooms
- 3 Bedrooms | 1 Main Level Bedroom
- Walk-In Closet
- 2 Full Bathrooms
Basement
- Partial Basement
- Exterior Basement Entry
Parking
- 4 Parking Spaces
- 4 Open Parking Spaces
Outdoor Features
- Play Equipment
- Porch
Schools
- Ellis Elementary School
- Mt Logan Middle School
- Logan High School
Utilities
- Window Unit Cooling System
- Radiant Heating System
Community Details
- No Home Owners Association
Listing and Financial Details
- Exclusions: Basketball Standard, Dryer, Gas Grill/BBQ, Washer
- Assessor Parcel Number 02-035-0001
Map
Create a Home Valuation Report for This Property
The Home Valuation Report is an in-depth analysis detailing your home's value as well as a comparison with similar homes in the area
Home Values in the Area
Average Home Value in this Area
Tax History
| Year | Tax Paid | Tax Assessment Tax Assessment Total Assessment is a certain percentage of the fair market value that is determined by local assessors to be the total taxable value of land and additions on the property. | Land | Improvement |
|---|---|---|---|---|
| 2024 | $1,350 | $169,055 | $0 | $0 |
| 2023 | $1,418 | $169,260 | $0 | $0 |
| 2022 | $1,291 | $143,955 | $0 | $0 |
| 2021 | $1,155 | $198,956 | $42,000 | $156,956 |
| 2020 | $1,050 | $162,736 | $42,000 | $120,736 |
| 2019 | $1,097 | $162,736 | $42,000 | $120,736 |
| 2018 | $1,106 | $149,800 | $42,000 | $107,800 |
| 2017 | $1,057 | $75,710 | $0 | $0 |
| 2016 | $1,096 | $75,710 | $0 | $0 |
| 2015 | $983 | $67,820 | $0 | $0 |
| 2014 | $889 | $67,820 | $0 | $0 |
| 2013 | -- | $67,820 | $0 | $0 |
Source: Public Records
Property History
| Date | Event | Price | Change | Sq Ft Price |
|---|---|---|---|---|
| 06/22/2025 06/22/25 | Price Changed | $340,000 | -2.9% | $201 / Sq Ft |
| 06/09/2025 06/09/25 | Price Changed | $350,000 | -2.8% | $207 / Sq Ft |
| 05/29/2025 05/29/25 | Price Changed | $359,999 | -2.7% | $213 / Sq Ft |
| 05/20/2025 05/20/25 | For Sale | $369,999 | -- | $219 / Sq Ft |
Source: UtahRealEstate.com
Purchase History
| Date | Type | Sale Price | Title Company |
|---|---|---|---|
| Quit Claim Deed | -- | Pinnacle Title | |
| Quit Claim Deed | -- | Pinnacle Title | |
| Warranty Deed | -- | American Secure Title Logan | |
| Warranty Deed | -- | Cache Title Company |
Source: Public Records
Mortgage History
| Date | Status | Loan Amount | Loan Type |
|---|---|---|---|
| Previous Owner | $6,920 | Stand Alone Second | |
| Previous Owner | $135,500 | FHA | |
| Previous Owner | $129,222 | FHA | |
| Previous Owner | $110,000 | New Conventional |
Source: Public Records
Similar Homes in Logan, UT
Source: UtahRealEstate.com
MLS Number: 2086626
APN: 02-035-0001
Disclaimer: Certain information contained herein is derived from information provided by parties other than Homes.com. All information provided is deemed reliable, but is not guaranteed to be accurate and should be independently verified.
![]() IDX information is provided exclusively for consumers’ personal, non-commercial use, that it may not be used for any purpose other than to identify prospective properties consumers may be interested in purchasing, and that the data is deemed reliable but is not guaranteed accurate by the MLS. Licensor is only providing the MLS Content and not other sources of data provided in the Product.
IDX information is provided exclusively for consumers’ personal, non-commercial use, that it may not be used for any purpose other than to identify prospective properties consumers may be interested in purchasing, and that the data is deemed reliable but is not guaranteed accurate by the MLS. Licensor is only providing the MLS Content and not other sources of data provided in the Product.
Based on information from the Wasatch Front Regional Multiple Listing Service, Inc.. All data, including all measurements and calculations of area, is obtained from various sources and has not been, and will not be, verified by broker or the MLS. All information should be independently reviewed and verified for accuracy. Properties may or may not be listed by the office/agent presenting the information.
Nearby Homes