Estimated Value: $40,000 - $117,000
4
Beds
1
Bath
888
Sq Ft
$88/Sq Ft
Est. Value
About This Home
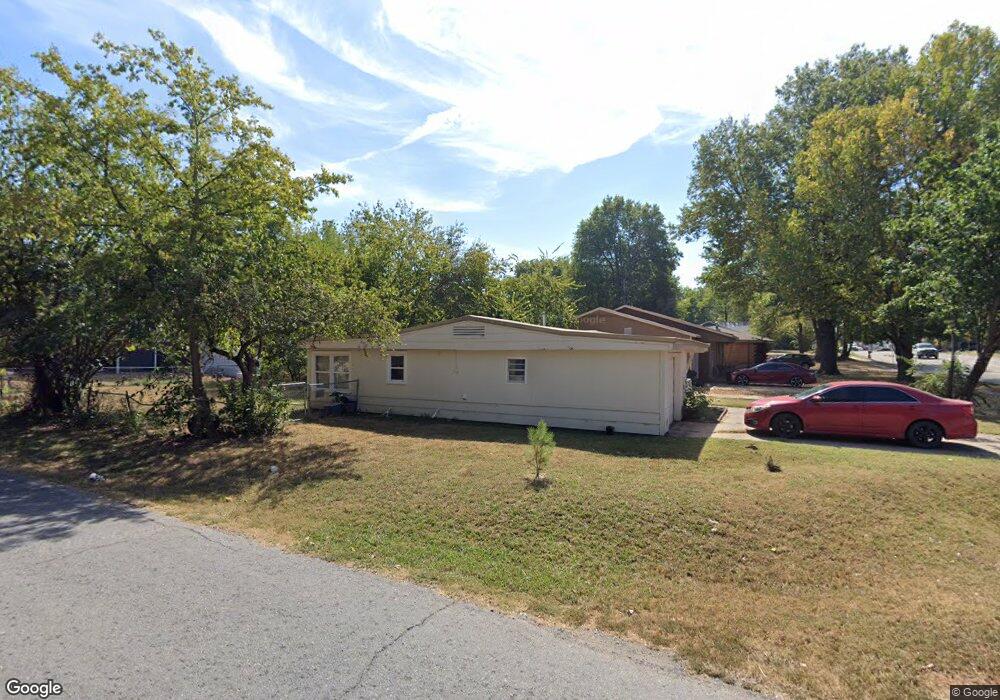
This home is located at 201 S Elliott St, Pryor, OK 74361 and is currently estimated at $78,500, approximately $88 per square foot. 201 S Elliott St is a home located in Mayes County with nearby schools including Pryor Middle School, Pryor High School, and William Bradford Christian School.
Ownership History
Date
Name
Owned For
Owner Type
Purchase Details
Closed on
Nov 7, 2018
Sold by
Cochrel Jeffrey W
Bought by
Sanford E Alvis Revocable Trust
Current Estimated Value
Purchase Details
Closed on
Oct 30, 2002
Sold by
Alvis Sanford Trust
Bought by
Faulconer Jason and Faulconer Pennie
Purchase Details
Closed on
Sep 17, 2002
Sold by
Hubert Stonie and Hubert Connie
Bought by
Alvis, Sanford Trust
Purchase Details
Closed on
Jan 11, 2002
Sold by
Alvis Sanford Trust
Bought by
Hubert Stonie and Hubert Connie
Purchase Details
Closed on
Nov 27, 2001
Sold by
Collette Marion and Collette Mary
Bought by
Alvis, Sanford Trust
Purchase Details
Closed on
Apr 26, 2001
Sold by
Alvis Sanford
Bought by
Collette Marion and Collette Mary
Purchase Details
Closed on
Apr 10, 2001
Sold by
Orman Jerry Allen
Bought by
Alvis Sanford E
Purchase Details
Closed on
Jul 18, 1997
Sold by
Alvis Sanford
Bought by
Orman Jerry Allen
Purchase Details
Closed on
Jul 25, 1994
Sold by
Alvis Sanford E
Bought by
Bolding James E
Create a Home Valuation Report for This Property
The Home Valuation Report is an in-depth analysis detailing your home's value as well as a comparison with similar homes in the area
Home Values in the Area
Average Home Value in this Area
Purchase History
| Date | Buyer | Sale Price | Title Company |
|---|---|---|---|
| Sanford E Alvis Revocable Trust | -- | None Available | |
| Faulconer Jason | $25,000 | -- | |
| Alvis, Sanford Trust | -- | -- | |
| Hubert Stonie | $35,000 | -- | |
| Alvis, Sanford Trust | -- | -- | |
| Collette Marion | $32,000 | -- | |
| Alvis Sanford E | -- | -- | |
| Orman Jerry Allen | $27,000 | -- | |
| Bolding James E | $32,000 | -- |
Source: Public Records
Tax History Compared to Growth
Tax History
| Year | Tax Paid | Tax Assessment Tax Assessment Total Assessment is a certain percentage of the fair market value that is determined by local assessors to be the total taxable value of land and additions on the property. | Land | Improvement |
|---|---|---|---|---|
| 2023 | $478 | $5,510 | $2,369 | $3,141 |
| 2022 | $439 | $5,248 | $2,369 | $2,879 |
| 2021 | $369 | $4,373 | $2,043 | $2,330 |
| 2020 | $345 | $4,165 | $1,894 | $2,271 |
| 2019 | $339 | $3,966 | $1,759 | $2,207 |
| 2018 | $321 | $3,777 | $1,628 | $2,149 |
| 2017 | $284 | $3,598 | $1,524 | $2,074 |
| 2016 | $273 | $3,426 | $1,438 | $1,988 |
| 2015 | $278 | $3,426 | $1,438 | $1,988 |
| 2014 | $278 | $3,426 | $1,438 | $1,988 |
Source: Public Records
Map
Nearby Homes
- 215 S Elliott St
- 0 S Orphan St
- 207 S Orphan St
- 102 S Elliott St
- 20 S Elliott St
- 107 S Coo Y Yah St
- 3 N Ora St
- 1221 SE Graham Ct
- 117 S Vann St
- 303 SE 3rd St
- 115 N Indianola St
- 111 Irving St
- 201 N Indianola St
- 303 SE 5th St
- 0 N 4318 Rd Unit 2522371
- 4748 N 4318 Rd
- 000 483 Rd
- 201 N Coo Y Yah St
- 420 S Adair St
- 315 Savannah Park
- 203 S Elliott St
- 123 S Elliott St
- 205 S Elliott St
- 121 S Elliott St
- 212 S Indianola St
- 816 SE 2nd St
- 815 SE 2nd St
- 202 S Elliott St
- 119 S Elliott St
- 207 S Elliott St
- 122 S Indianola St
- 216 S Indianola
- 120 S Indianola St
- 120 S Elliott St
- 211 S Elliott St
- 902 SE 2nd St
- 115 S Elliott St
- 116 S Indianola St
- 212 S Elliott St
- 903 SE 2nd St