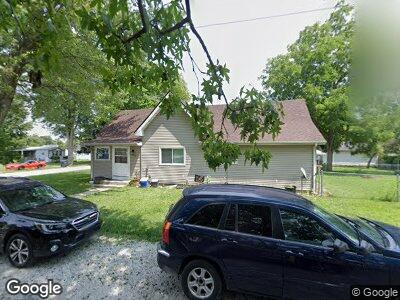
201 S Jefferson St van Buren, IN 46991
Estimated Value: $92,456 - $118,000
2
Beds
1
Bath
1,224
Sq Ft
$84/Sq Ft
Est. Value
About This Home
This home is located at 201 S Jefferson St, van Buren, IN 46991 and is currently estimated at $103,114, approximately $84 per square foot. 201 S Jefferson St is a home with nearby schools including Eastbrook High School.
Ownership History
Date
Name
Owned For
Owner Type
Purchase Details
Closed on
Jul 2, 2021
Sold by
Rans Michelle R
Bought by
Rans Andrew J
Current Estimated Value
Home Financials for this Owner
Home Financials are based on the most recent Mortgage that was taken out on this home.
Original Mortgage
$63,200
Outstanding Balance
$49,923
Interest Rate
2.96%
Mortgage Type
Stand Alone Refi Refinance Of Original Loan
Estimated Equity
$57,940
Purchase Details
Closed on
Aug 3, 2005
Sold by
Jackson Alphonso
Bought by
Federal Housing Commissioner
Home Financials for this Owner
Home Financials are based on the most recent Mortgage that was taken out on this home.
Original Mortgage
$51,200
Interest Rate
5.62%
Mortgage Type
Adjustable Rate Mortgage/ARM
Purchase Details
Closed on
Oct 31, 2002
Sold by
Not Provided
Bought by
Not Provided
Create a Home Valuation Report for This Property
The Home Valuation Report is an in-depth analysis detailing your home's value as well as a comparison with similar homes in the area
Home Values in the Area
Average Home Value in this Area
Purchase History
| Date | Buyer | Sale Price | Title Company |
|---|---|---|---|
| Rans Andrew J | -- | None Available | |
| Federal Housing Commissioner | -- | Contract Processing And Titl | |
| Not Provided | $75,000 | -- |
Source: Public Records
Mortgage History
| Date | Status | Borrower | Loan Amount |
|---|---|---|---|
| Open | Rans Andrew J | $63,200 | |
| Previous Owner | Rans Andrew J | $54,000 | |
| Previous Owner | Rans Michelle R | $11,400 | |
| Previous Owner | Federal Housing Commissioner | $51,200 |
Source: Public Records
Tax History Compared to Growth
Tax History
| Year | Tax Paid | Tax Assessment Tax Assessment Total Assessment is a certain percentage of the fair market value that is determined by local assessors to be the total taxable value of land and additions on the property. | Land | Improvement |
|---|---|---|---|---|
| 2024 | $391 | $70,900 | $11,400 | $59,500 |
| 2023 | $368 | $69,500 | $11,400 | $58,100 |
| 2022 | $338 | $68,700 | $7,300 | $61,400 |
| 2021 | $310 | $63,300 | $7,300 | $56,000 |
| 2020 | $272 | $61,400 | $7,300 | $54,100 |
| 2019 | $245 | $58,300 | $7,300 | $51,000 |
| 2018 | $220 | $57,600 | $7,300 | $50,300 |
| 2017 | $202 | $55,900 | $7,300 | $48,600 |
| 2016 | $200 | $57,900 | $7,300 | $50,600 |
| 2014 | $173 | $55,300 | $7,300 | $48,000 |
| 2013 | $173 | $54,200 | $7,300 | $46,900 |
Source: Public Records
Map
Nearby Homes
- 205 E Main St
- 509 W Main St
- 210 N Wayne St
- 809 W Main St
- 9252 County Road 300 N
- 7974 E 300 N
- 2127 N 900 E
- 11753 S Milo Rd
- 7630 E 100 S
- 4402 E 100 N
- 1553 S 1000 E
- 0 Jadden Rd
- 0925 W State Road 18
- 428 N Nancy St
- TBD Bennett Dr
- 2876 W 600 N
- 3671 N Moorland Dr
- 1247 N Wayne St
- 2010 E Bocock Rd
- 5928 E Montpelier Pike