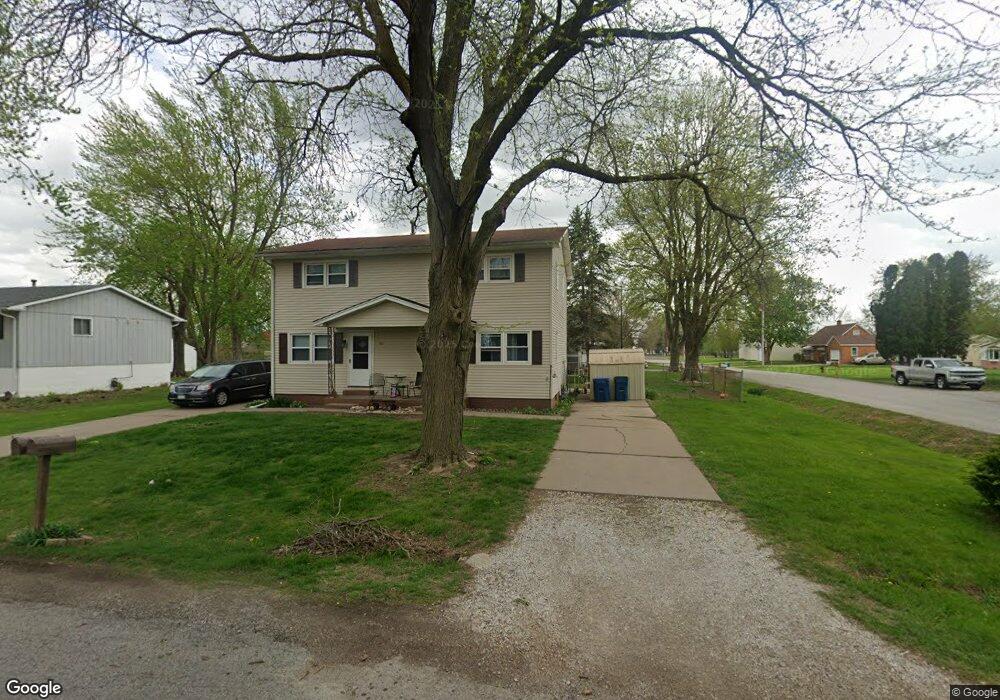
201 Salem St Blue Grass, IA 52726
Estimated Value: $194,000 - $245,366
4
Beds
2
Baths
1,872
Sq Ft
$117/Sq Ft
Est. Value
About This Home
This home is located at 201 Salem St, Blue Grass, IA 52726 and is currently estimated at $218,092, approximately $116 per square foot. 201 Salem St is a home located in Scott County with nearby schools including Blue Grass Elementary School, Walcott Intermediate School, and West High School.
Ownership History
Date
Name
Owned For
Owner Type
Purchase Details
Closed on
Sep 23, 2025
Sold by
Haines Amber D
Bought by
Jepsen Jordan J
Current Estimated Value
Home Financials for this Owner
Home Financials are based on the most recent Mortgage that was taken out on this home.
Original Mortgage
$185,600
Outstanding Balance
$185,600
Interest Rate
6.58%
Mortgage Type
New Conventional
Estimated Equity
$32,492
Purchase Details
Closed on
Aug 10, 2021
Sold by
Benson Lawrence J and Lawrence J Benson Trust
Bought by
Haines Amber D
Home Financials for this Owner
Home Financials are based on the most recent Mortgage that was taken out on this home.
Original Mortgage
$127,500
Interest Rate
2.9%
Mortgage Type
Future Advance Clause Open End Mortgage
Purchase Details
Closed on
Mar 11, 2014
Sold by
Benson Lawrence J and Benson Alice A
Bought by
Benson Lawrence J and Benson Alice A
Create a Home Valuation Report for This Property
The Home Valuation Report is an in-depth analysis detailing your home's value as well as a comparison with similar homes in the area
Home Values in the Area
Average Home Value in this Area
Purchase History
| Date | Buyer | Sale Price | Title Company |
|---|---|---|---|
| Jepsen Jordan J | $232,000 | None Listed On Document | |
| Haines Amber D | $171,000 | None Available | |
| Benson Lawrence J | -- | None Available |
Source: Public Records
Mortgage History
| Date | Status | Borrower | Loan Amount |
|---|---|---|---|
| Open | Jepsen Jordan J | $185,600 | |
| Previous Owner | Haines Amber D | $127,500 |
Source: Public Records
Tax History Compared to Growth
Tax History
| Year | Tax Paid | Tax Assessment Tax Assessment Total Assessment is a certain percentage of the fair market value that is determined by local assessors to be the total taxable value of land and additions on the property. | Land | Improvement |
|---|---|---|---|---|
| 2025 | $3,232 | $215,800 | $25,300 | $190,500 |
| 2024 | $3,136 | $208,600 | $25,300 | $183,300 |
| 2023 | $2,974 | $208,600 | $25,300 | $183,300 |
| 2022 | $2,932 | $159,720 | $22,460 | $137,260 |
| 2021 | $2,932 | $159,720 | $22,460 | $137,260 |
| 2020 | $2,728 | $148,230 | $22,460 | $125,770 |
| 2019 | $2,656 | $137,090 | $14,980 | $122,110 |
| 2018 | $2,626 | $137,090 | $14,980 | $122,110 |
| 2017 | $2,384 | $137,090 | $14,980 | $122,110 |
| 2016 | $2,336 | $122,160 | $0 | $0 |
| 2015 | $2,336 | $116,810 | $0 | $0 |
| 2014 | $2,264 | $116,810 | $0 | $0 |
| 2013 | $2,218 | $0 | $0 | $0 |
| 2012 | -- | $118,000 | $14,980 | $103,020 |
Source: Public Records
Map
Nearby Homes
- 702 N Juniata St
- 126 S Genessee St
- 423 Kevin Rd
- 401 Dolan Dr
- 680 Sweet Wood Ln
- 501 Prairie Meadow Dr
- 508 Prairie Meadow Dr
- 13109 83rd Ave
- 12505 70th Ave
- 3881 Highway 61
- 6594 116th St
- 11640 61st Avenue Place
- 6203 116th St
- 6218 114th St
- 5 E Timberline Dr
- 1875 Stagecoach Ln
- 3701 165th St
- 1240 Spruce St
- 222 6th St
- 636 3rd St
- 205 Salem St
- 537 N Neisse St
- 603 N Neisse St
- 202 Salem St
- 542 N Neisse St
- 209 Salem St
- 526 N Neisse St
- 608 N Neisse St
- 540 N Genessee St
- 206 Salem St
- 536 N Genessee St
- 520 N Neisse St
- 612 N Neisse St
- 210 Salem St
- 607 N Neisse St
- 532 N Genessee St
- 514 N Neisse St
- 616 N Neisse St
- 209 E Lotte St
- 103 W Lotte St