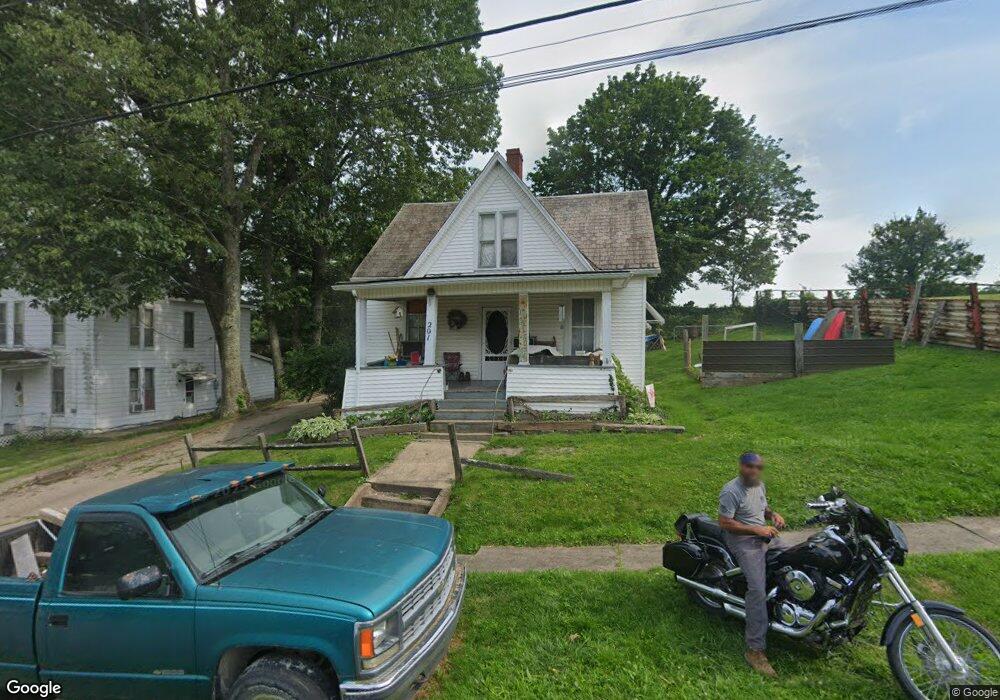
201 Spring St Flushing, OH 43977
Estimated Value: $56,000 - $87,000
2
Beds
1
Bath
624
Sq Ft
$111/Sq Ft
Est. Value
About This Home
This home is located at 201 Spring St, Flushing, OH 43977 and is currently estimated at $69,146, approximately $110 per square foot. 201 Spring St is a home located in Belmont County with nearby schools including Union Local Elementary School, Union Local Middle School, and Union Local High School.
Ownership History
Date
Name
Owned For
Owner Type
Purchase Details
Closed on
Jul 22, 2005
Sold by
Bailey Donald E and Bailey Bonnie L
Bought by
Benedetta Dean A
Current Estimated Value
Home Financials for this Owner
Home Financials are based on the most recent Mortgage that was taken out on this home.
Original Mortgage
$39,900
Outstanding Balance
$20,402
Interest Rate
5.74%
Mortgage Type
New Conventional
Estimated Equity
$48,744
Purchase Details
Closed on
Sep 30, 2002
Sold by
Macy Mellisa K Cheryl A
Bought by
Macy Mellisa K Cheryl A
Purchase Details
Closed on
May 1, 2000
Sold by
Mcbride Michael P
Bought by
Mcbride Michael P
Purchase Details
Closed on
Jul 16, 1996
Sold by
Mcbride Michael P
Bought by
Mcbride Michael P
Purchase Details
Closed on
Jan 1, 1986
Sold by
Grimes Elsie
Bought by
Grimes Elsie
Create a Home Valuation Report for This Property
The Home Valuation Report is an in-depth analysis detailing your home's value as well as a comparison with similar homes in the area
Purchase History
| Date | Buyer | Sale Price | Title Company |
|---|---|---|---|
| Benedetta Dean A | $31,500 | None Available | |
| Macy Mellisa K Cheryl A | $24,000 | -- | |
| Mcbride Michael P | -- | -- | |
| Mcbride Michael P | $16,000 | -- | |
| Grimes Elsie | -- | -- |
Source: Public Records
Mortgage History
| Date | Status | Borrower | Loan Amount |
|---|---|---|---|
| Open | Benedetta Dean A | $39,900 |
Source: Public Records
Tax History
| Year | Tax Paid | Tax Assessment Tax Assessment Total Assessment is a certain percentage of the fair market value that is determined by local assessors to be the total taxable value of land and additions on the property. | Land | Improvement |
|---|---|---|---|---|
| 2025 | $582 | $15,290 | $2,050 | $13,240 |
| 2023 | $453 | $11,270 | $2,070 | $9,200 |
| 2022 | $453 | $11,270 | $2,072 | $9,198 |
| 2021 | $451 | $11,270 | $2,072 | $9,198 |
| 2020 | $418 | $9,800 | $1,800 | $8,000 |
| 2019 | $431 | $9,800 | $1,800 | $8,000 |
| 2018 | $413 | $9,800 | $1,800 | $8,000 |
| 2017 | $321 | $7,690 | $1,330 | $6,360 |
| 2016 | $326 | $7,690 | $1,330 | $6,360 |
| 2015 | $334 | $7,690 | $1,330 | $6,360 |
| 2014 | $377 | $8,510 | $1,210 | $7,300 |
| 2013 | $369 | $8,510 | $1,210 | $7,300 |
Source: Public Records
Map
Nearby Homes
- 117 A&B High St
- 39775 Rosemary Camp Rd
- 41152 Black Oak Rd
- 0 Holloway Rd State Rt 331 Unit 5067951
- 409 Ashton St
- 77900 Slater Rd
- 70799 Bannock Uniontown Rd
- INLOT 19 Havenwood
- V/L Shephard Rd
- 38400 Cadiz-Piedmont Rd
- 19 acres Saffell Rd
- 15 acres Saffell Rd
- 35 acres Saffell Rd
- 67290 National New Lafferty Rd
- 73310 Hazelwood Hills Rd
- 34810 Nelson Dr
- 34683 Sunshine Rd
- 34670 Nelson Dr
- 67174 Pancoast Rd S
- 69680 Main St
- 203 Spring St
- 200 Spring St
- 122 Morristown St
- 205 Spring St
- 120 Morristown St
- 207 Spring St
- 206 Market St
- 206 Market St
- 209 Spring St
- 118 Morristown St
- 205 Morristown St
- 211 Spring St
- 204 Spring St
- 201 Morristown St
- 123 Morristown St
- 207 Morristown St
- 121 Morristown St
- 213 Spring St
- 164 Spring St
- 208 Spring St
Your Personal Tour Guide
Ask me questions while you tour the home.