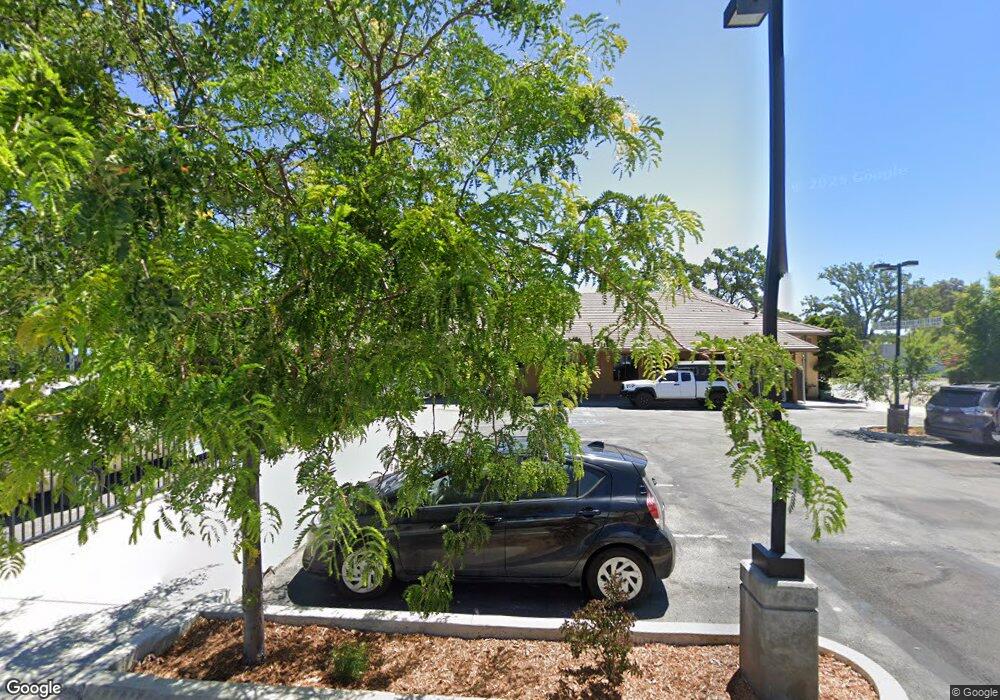
201 Spring St Paso Robles, CA 93446
Studio
--
Bath
5,014
Sq Ft
20,473
Sq Ft Lot
About This Home
This home is located at 201 Spring St, Paso Robles, CA 93446. 201 Spring St is a home located in San Luis Obispo County with nearby schools including Glen Speck Elementary School, George H. Flamson Middle School, and Paso Robles High School.
Ownership History
Date
Name
Owned For
Owner Type
Purchase Details
Closed on
Jan 9, 2015
Sold by
Smith Linda L
Bought by
Smith Brent R
Home Financials for this Owner
Home Financials are based on the most recent Mortgage that was taken out on this home.
Original Mortgage
$1,200,000
Outstanding Balance
$915,787
Interest Rate
3.82%
Mortgage Type
Commercial
Purchase Details
Closed on
Dec 1, 2014
Sold by
Gambril Rick and Gambril Teri K
Bought by
Smith Brent R
Home Financials for this Owner
Home Financials are based on the most recent Mortgage that was taken out on this home.
Original Mortgage
$1,200,000
Outstanding Balance
$915,787
Interest Rate
3.82%
Mortgage Type
Commercial
Purchase Details
Closed on
Aug 4, 2011
Sold by
Heritage Oaks Bank
Bought by
Gambril Rick and Gambril Teri K
Purchase Details
Closed on
Aug 17, 2010
Sold by
Bryant Bobbie Ray and Bryant Helga E
Bought by
Heritage Oaks Bank
Create a Home Valuation Report for This Property
The Home Valuation Report is an in-depth analysis detailing your home's value as well as a comparison with similar homes in the area
Purchase History
| Date | Buyer | Sale Price | Title Company |
|---|---|---|---|
| Smith Brent R | -- | First American Title Company | |
| Smith Brent R | $1,200,000 | First American Title Ins | |
| Gambril Rick | -- | First American Title Company | |
| Heritage Oaks Bank | -- | Fidelity National Title Co |
Source: Public Records
Mortgage History
| Date | Status | Borrower | Loan Amount |
|---|---|---|---|
| Open | Smith Brent R | $1,200,000 |
Source: Public Records
Tax History
| Year | Tax Paid | Tax Assessment Tax Assessment Total Assessment is a certain percentage of the fair market value that is determined by local assessors to be the total taxable value of land and additions on the property. | Land | Improvement |
|---|---|---|---|---|
| 2025 | $10,807 | $991,516 | $444,680 | $546,836 |
| 2024 | $10,631 | $972,075 | $435,961 | $536,114 |
| 2023 | $10,631 | $953,015 | $427,413 | $525,602 |
| 2022 | $10,473 | $934,330 | $419,033 | $515,297 |
| 2021 | $10,809 | $916,011 | $410,817 | $505,194 |
| 2020 | $10,154 | $906,619 | $406,605 | $500,014 |
| 2019 | $10,010 | $888,843 | $398,633 | $490,210 |
| 2018 | $9,874 | $871,416 | $390,817 | $480,599 |
| 2017 | $9,284 | $854,330 | $383,154 | $471,176 |
| 2016 | $9,102 | $837,580 | $375,642 | $461,938 |
| 2015 | $8,041 | $731,571 | $276,952 | $454,619 |
| 2014 | $7,762 | $717,241 | $271,527 | $445,714 |
Source: Public Records
Map
Nearby Homes
Your Personal Tour Guide
Ask me questions while you tour the home.