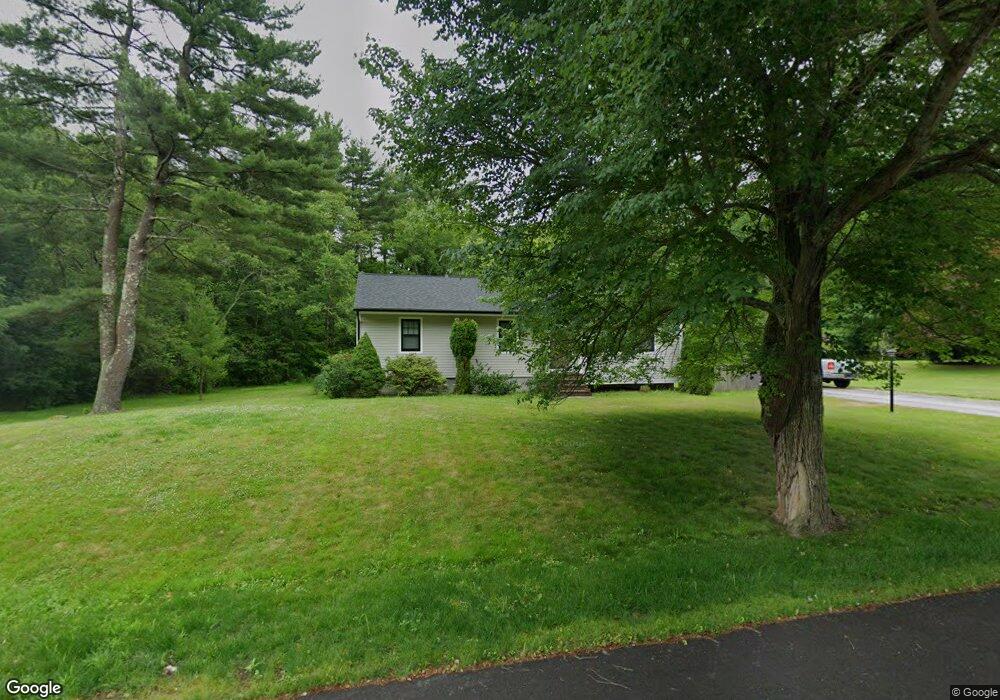
201 Union St East Bridgewater, MA 02333
Estimated Value: $492,464 - $556,000
3
Beds
2
Baths
1,146
Sq Ft
$457/Sq Ft
Est. Value
About This Home
This home is located at 201 Union St, East Bridgewater, MA 02333 and is currently estimated at $523,866, approximately $457 per square foot. 201 Union St is a home located in Plymouth County with nearby schools including Central Elementary School, Gordon W Mitchell Middle School, and East Bridgewater Jr./Sr. High School.
Ownership History
Date
Name
Owned For
Owner Type
Purchase Details
Closed on
Mar 1, 2011
Sold by
Fnma
Bought by
Poverchuk Amanda
Current Estimated Value
Home Financials for this Owner
Home Financials are based on the most recent Mortgage that was taken out on this home.
Original Mortgage
$204,578
Outstanding Balance
$140,300
Interest Rate
4.75%
Mortgage Type
Purchase Money Mortgage
Estimated Equity
$383,566
Purchase Details
Closed on
Apr 1, 2010
Sold by
Byron Diane M and Byron Mark
Bought by
Federal National Mortgage Association
Purchase Details
Closed on
Sep 28, 2006
Sold by
Bezio Robert H and Bezio Anne
Bought by
Byron Mark and Byron Diane
Home Financials for this Owner
Home Financials are based on the most recent Mortgage that was taken out on this home.
Original Mortgage
$249,600
Interest Rate
6.52%
Mortgage Type
Purchase Money Mortgage
Create a Home Valuation Report for This Property
The Home Valuation Report is an in-depth analysis detailing your home's value as well as a comparison with similar homes in the area
Home Values in the Area
Average Home Value in this Area
Purchase History
| Date | Buyer | Sale Price | Title Company |
|---|---|---|---|
| Poverchuk Amanda | $209,000 | -- | |
| Federal National Mortgage Association | $266,376 | -- | |
| Byron Mark | $312,000 | -- |
Source: Public Records
Mortgage History
| Date | Status | Borrower | Loan Amount |
|---|---|---|---|
| Open | Poverchuk Amanda | $204,578 | |
| Previous Owner | Byron Mark | $249,600 | |
| Previous Owner | Byron Mark | $62,400 | |
| Previous Owner | Byron Mark | $100,000 |
Source: Public Records
Tax History Compared to Growth
Tax History
| Year | Tax Paid | Tax Assessment Tax Assessment Total Assessment is a certain percentage of the fair market value that is determined by local assessors to be the total taxable value of land and additions on the property. | Land | Improvement |
|---|---|---|---|---|
| 2025 | $5,920 | $433,100 | $177,200 | $255,900 |
| 2024 | $5,813 | $420,000 | $170,400 | $249,600 |
| 2023 | $5,709 | $395,100 | $170,400 | $224,700 |
| 2022 | $5,644 | $361,800 | $155,000 | $206,800 |
| 2021 | $5,451 | $319,700 | $148,900 | $170,800 |
| 2020 | $5,355 | $309,700 | $143,200 | $166,500 |
| 2019 | $5,191 | $295,600 | $136,800 | $158,800 |
| 2018 | $4,912 | $273,500 | $136,800 | $136,700 |
| 2017 | $4,771 | $260,700 | $130,500 | $130,200 |
| 2016 | $4,644 | $255,700 | $130,500 | $125,200 |
| 2015 | $4,495 | $253,100 | $129,600 | $123,500 |
| 2014 | $4,315 | $248,400 | $126,900 | $121,500 |
Source: Public Records
Map
Nearby Homes
- 11 Harmony Crossing
- 41 Bedford St
- 71 Church St
- 11 Willow Ave
- 9 Hemlock Dr
- 14 Mountain Ash Rd
- 282 Spring St
- 261 Plymouth St
- 585 N Bedford St
- 611 N Bedford St
- 416 Highland St
- 1 Simmons Place
- 78 Crystal Water Dr
- 407 W Union St
- 446 Elm St
- 217 Crystal Water Dr
- 505 N Central St
- 182 Crystal Water Dr Unit 182
- 936 Central St
- 455 Plymouth St