201 W 31st St Lumberton, NC 28358
Estimated Value: $202,000 - $233,003
3
Beds
2
Baths
1,581
Sq Ft
$134/Sq Ft
Est. Value
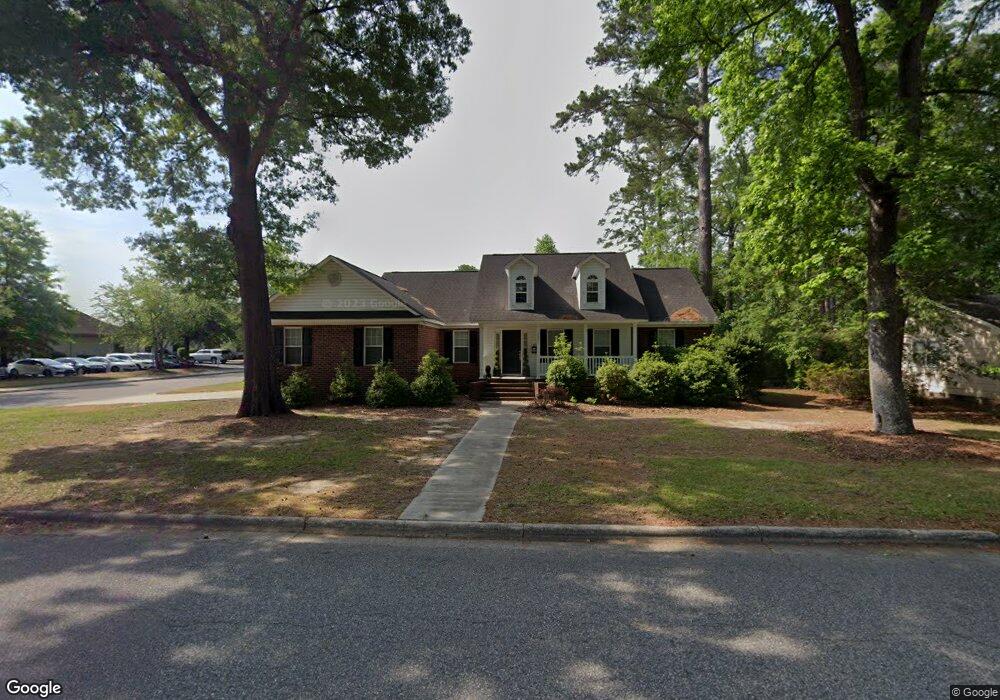
About This Home
This home is located at 201 W 31st St, Lumberton, NC 28358 and is currently estimated at $211,751, approximately $133 per square foot. 201 W 31st St is a home located in Robeson County with nearby schools including Tanglewood Elementary School, Parkton Elementary School, and L. Gilbert Carroll Middle School.
Ownership History
Date
Name
Owned For
Owner Type
Purchase Details
Closed on
May 4, 2009
Sold by
D & E Nc Llc
Bought by
Lee Nicholas Wayne
Current Estimated Value
Home Financials for this Owner
Home Financials are based on the most recent Mortgage that was taken out on this home.
Original Mortgage
$146,400
Outstanding Balance
$92,549
Interest Rate
4.86%
Mortgage Type
Purchase Money Mortgage
Estimated Equity
$119,202
Purchase Details
Closed on
Apr 30, 2008
Sold by
Allen Teresa W
Bought by
D & E Of Nc Llc
Home Financials for this Owner
Home Financials are based on the most recent Mortgage that was taken out on this home.
Original Mortgage
$150,000
Interest Rate
5.84%
Mortgage Type
Construction
Create a Home Valuation Report for This Property
The Home Valuation Report is an in-depth analysis detailing your home's value as well as a comparison with similar homes in the area
Home Values in the Area
Average Home Value in this Area
Purchase History
| Date | Buyer | Sale Price | Title Company |
|---|---|---|---|
| Lee Nicholas Wayne | $183,000 | -- | |
| D & E Of Nc Llc | $33,000 | -- |
Source: Public Records
Mortgage History
| Date | Status | Borrower | Loan Amount |
|---|---|---|---|
| Open | Lee Nicholas Wayne | $146,400 | |
| Previous Owner | D & E Of Nc Llc | $150,000 |
Source: Public Records
Tax History Compared to Growth
Tax History
| Year | Tax Paid | Tax Assessment Tax Assessment Total Assessment is a certain percentage of the fair market value that is determined by local assessors to be the total taxable value of land and additions on the property. | Land | Improvement |
|---|---|---|---|---|
| 2025 | $1,528 | $193,100 | $22,000 | $171,100 |
| 2024 | $1,523 | $193,100 | $22,000 | $171,100 |
| 2023 | $1,311 | $164,000 | $20,000 | $144,000 |
| 2022 | $1,311 | $164,000 | $20,000 | $144,000 |
| 2021 | $1,311 | $164,000 | $20,000 | $144,000 |
| 2020 | $1,296 | $164,000 | $20,000 | $144,000 |
| 2018 | $1,323 | $146,500 | $5,000 | $141,500 |
| 2017 | $1,342 | $146,500 | $5,000 | $141,500 |
| 2016 | $1,342 | $146,500 | $5,000 | $141,500 |
| 2015 | $1,342 | $146,500 | $5,000 | $141,500 |
| 2014 | $1,342 | $146,500 | $5,000 | $141,500 |
Source: Public Records
Map
Nearby Homes