201 W Main St Decherd, TN 37324
Estimated Value: $123,000 - $230,000
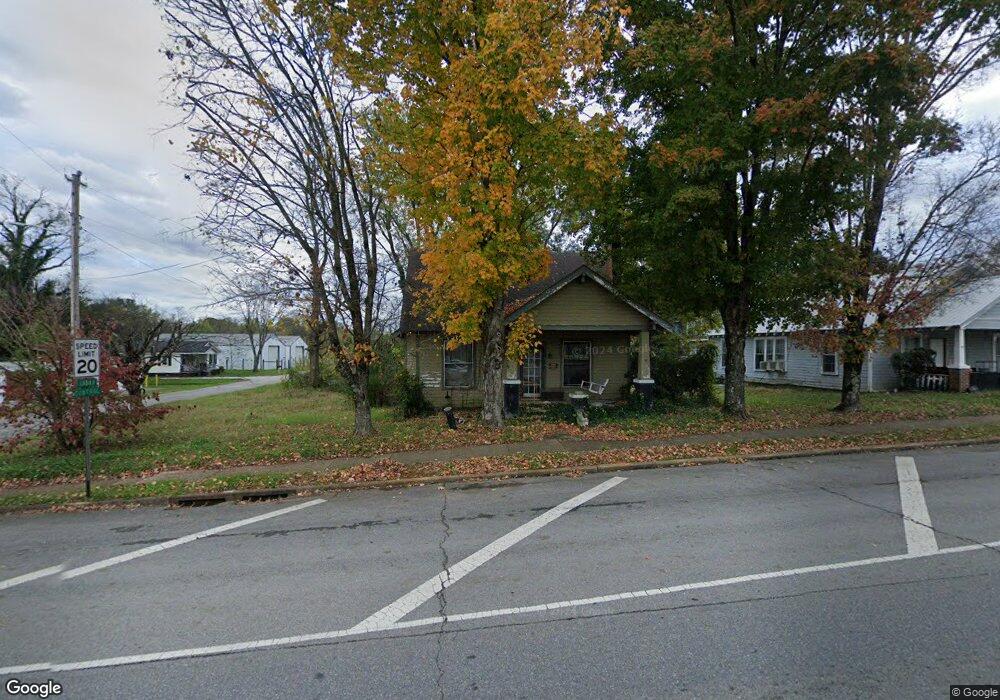
About This Home
This home is located at 201 W Main St, Decherd, TN 37324 and is currently estimated at $169,422, approximately $141 per square foot. 201 W Main St is a home located in Franklin County with nearby schools including North Middle School, South Middle School, and Franklin County High School.
Ownership History
We collect this data history from publicly available records. To have your information removed, we recommend requesting removal directly through your county’s website.
Purchase Details
Purchase Details
Purchase Details
Purchase History
We collect this data history from publicly available records. To have your information removed, we recommend requesting removal directly through your county’s website.
| Date | Buyer | Sale Price | Title Company |
|---|---|---|---|
| $36,600 | -- | ||
| -- | -- | ||
| -- | -- |
Tax History
We collect this data history from publicly available records. To have your information removed, we recommend requesting removal directly through your county’s website.
| Year | Tax Paid | Tax Assessment Tax Assessment Total Assessment is a certain percentage of the fair market value that is determined by local assessors to be the total taxable value of land and additions on the property. | Land | Improvement |
|---|---|---|---|---|
| 2025 | -- | $20,875 | $2,650 | $18,225 |
| 2024 | -- | $20,875 | $2,650 | $18,225 |
| 2023 | $575 | $20,875 | $2,650 | $18,225 |
| 2022 | $543 | $20,875 | $2,650 | $18,225 |
| 2021 | $368 | $20,875 | $2,650 | $18,225 |
| 2020 | $526 | $13,125 | $1,975 | $11,150 |
| 2019 | $526 | $13,125 | $1,975 | $11,150 |
| 2018 | $499 | $13,125 | $1,975 | $11,150 |
| 2017 | $499 | $13,125 | $1,975 | $11,150 |
| 2016 | $455 | $11,950 | $1,975 | $9,975 |
| 2015 | $455 | $11,950 | $1,975 | $9,975 |
| 2014 | $455 | $11,943 | $0 | $0 |
Map
- 302 W Main St
- 406 Cherry St
- 501 W Broad St
- 106 5th Ave N
- 107 N West St
- 301 Bennett St
- 404 Horton St
- 100 Waggoner St
- 905 Nicholson St
- 108 Weaver St
- 1001 Henley St
- 62 Modena Place
- 401 E Petty Ln
- 324 Laster Holman Rd
- 204 Tammy Dr
- 105 Lakeview Dr
- 651 Williams St
- 110 Dotson Ln
- 207 Mary Sharp Dr
- 301 Laster-Holman Ln
Ask me questions while you tour the home.