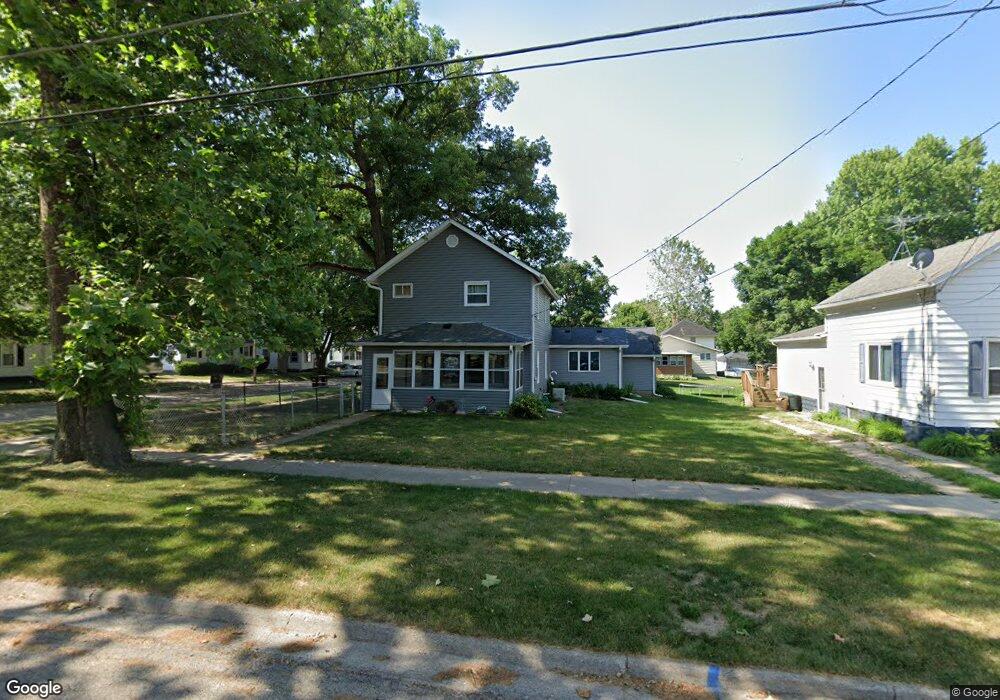
201 W Park St Morrison, IL 61270
Estimated Value: $105,000 - $121,000
4
Beds
2
Baths
1,700
Sq Ft
$67/Sq Ft
Est. Value
About This Home
This home is located at 201 W Park St, Morrison, IL 61270 and is currently estimated at $113,215, approximately $66 per square foot. 201 W Park St is a home located in Whiteside County with nearby schools including Northside School, Southside School, and Morrison Junior High School.
Ownership History
Date
Name
Owned For
Owner Type
Purchase Details
Closed on
Jan 11, 2019
Sold by
Rus Teri
Bought by
Rus Darrin T
Current Estimated Value
Purchase Details
Closed on
May 1, 2009
Sold by
Schaver H Roger
Bought by
Rus Darrin T
Home Financials for this Owner
Home Financials are based on the most recent Mortgage that was taken out on this home.
Original Mortgage
$73,250
Interest Rate
5.05%
Mortgage Type
New Conventional
Purchase Details
Closed on
Apr 23, 2009
Sold by
Smojver Evelyn R and Schaver John R
Bought by
Schaver H Roger
Home Financials for this Owner
Home Financials are based on the most recent Mortgage that was taken out on this home.
Original Mortgage
$73,250
Interest Rate
5.05%
Mortgage Type
New Conventional
Purchase Details
Closed on
Jul 19, 2006
Sold by
Schaver Winnie
Bought by
Schaver H Roger
Create a Home Valuation Report for This Property
The Home Valuation Report is an in-depth analysis detailing your home's value as well as a comparison with similar homes in the area
Home Values in the Area
Average Home Value in this Area
Purchase History
We collect this data history from publicly available records. To have your information removed, we recommend requesting removal directly through your county’s website.
| Date | Buyer | Sale Price | Title Company |
|---|---|---|---|
| Rus Darrin T | -- | -- | |
| Rus Darrin T | $72,000 | None Available | |
| Schaver H Roger | -- | None Available | |
| Schaver H Roger | -- | None Available |
Source: Public Records
Mortgage History
We collect this data history from publicly available records. To have your information removed, we recommend requesting removal directly through your county’s website.
| Date | Status | Borrower | Loan Amount |
|---|---|---|---|
| Previous Owner | Rus Darrin T | $73,250 |
Source: Public Records
Tax History
| Year | Tax Paid | Tax Assessment Tax Assessment Total Assessment is a certain percentage of the fair market value that is determined by local assessors to be the total taxable value of land and additions on the property. | Land | Improvement |
|---|---|---|---|---|
| 2025 | $2,110 | $31,070 | $2,480 | $28,590 |
| 2024 | $1,821 | $28,325 | $2,261 | $26,064 |
| 2023 | $1,653 | $25,787 | $2,058 | $23,729 |
| 2022 | $1,516 | $23,948 | $1,911 | $22,037 |
| 2021 | $1,467 | $23,451 | $1,871 | $21,580 |
| 2020 | $1,503 | $23,895 | $1,906 | $21,989 |
| 2019 | $1,622 | $25,118 | $2,350 | $22,768 |
| 2018 | $1,682 | $25,005 | $2,339 | $22,666 |
| 2017 | $1,542 | $24,020 | $2,247 | $21,773 |
| 2016 | $1,463 | $23,167 | $2,167 | $21,000 |
| 2015 | $1,547 | $23,732 | $2,220 | $21,512 |
| 2014 | $1,531 | $23,464 | $2,195 | $21,269 |
| 2013 | $1,547 | $23,732 | $2,220 | $21,512 |
Source: Public Records
Map
Nearby Homes
- 210 W Morris St
- 407 S Cherry St
- 411 W Park St
- 301 E Wall St
- 305 S Clinton St
- 402 W Lincolnway
- 418 E Wall St
- 505 E Main St
- 513 E Main St
- 300 Prospect St
- 504 Ash Ave
- 208 Johnson St
- 624 W Lincolnway
- 814 W Park St
- 505 S Jackson St
- 00 N Jackson St
- 802 Glenwood Dr
- 13831 Prairie Center Rd
- 14740 Norrish Rd
- 13629 Garden Plain Rd
Your Personal Tour Guide
Ask me questions while you tour the home.