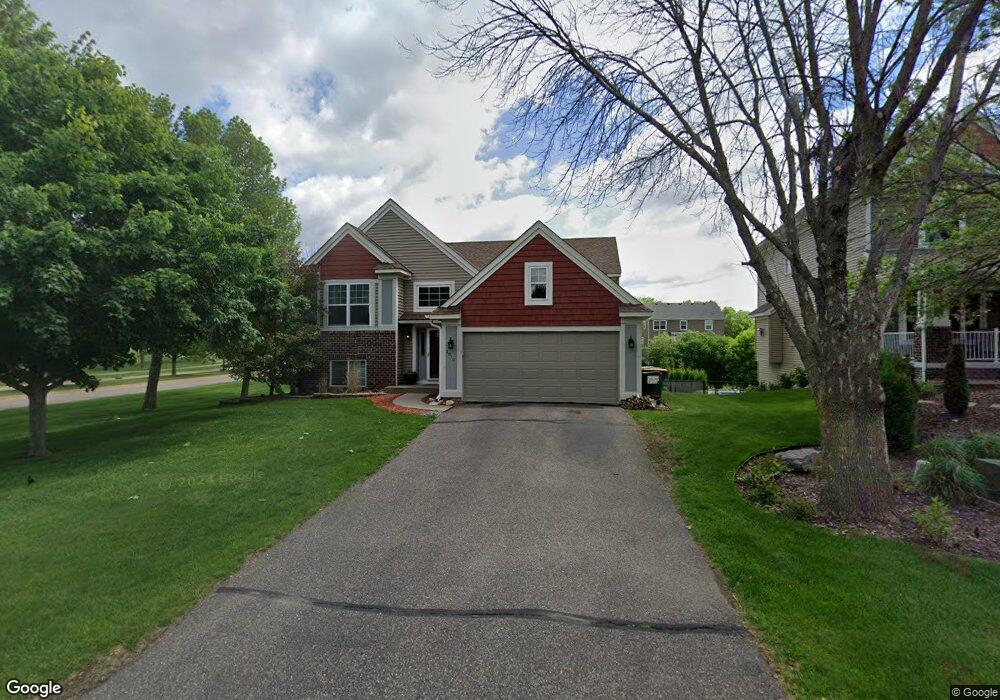
2010 112th Cir NE Minneapolis, MN 55449
Estimated Value: $456,000 - $486,000
4
Beds
2
Baths
1,308
Sq Ft
$356/Sq Ft
Est. Value
About This Home
This home is located at 2010 112th Cir NE, Minneapolis, MN 55449 and is currently estimated at $465,753, approximately $356 per square foot. 2010 112th Cir NE is a home located in Anoka County with nearby schools including Northpoint Elementary School, Westwood Intermediate and Middle School, and Innovation Science & Tech Academy.
Ownership History
Date
Name
Owned For
Owner Type
Purchase Details
Closed on
Aug 23, 2018
Sold by
Bensaad Nawal Soraya and Bensaad Johnson Nawal Soraya
Bought by
Quinn Anthony and Quinn Brandy A
Current Estimated Value
Home Financials for this Owner
Home Financials are based on the most recent Mortgage that was taken out on this home.
Original Mortgage
$291,208
Outstanding Balance
$253,564
Interest Rate
4.62%
Mortgage Type
FHA
Estimated Equity
$212,189
Purchase Details
Closed on
Nov 7, 2012
Sold by
Miller Nora R
Bought by
Bensaad Johnson Nawal Soraya
Home Financials for this Owner
Home Financials are based on the most recent Mortgage that was taken out on this home.
Original Mortgage
$179,920
Interest Rate
3.37%
Mortgage Type
New Conventional
Purchase Details
Closed on
Jun 22, 2001
Sold by
The Rottlund Company Inc
Bought by
Polden Brady R and Polden Peggy M
Purchase Details
Closed on
Mar 13, 2001
Sold by
Sienna Corp
Bought by
The Rottlund Company
Create a Home Valuation Report for This Property
The Home Valuation Report is an in-depth analysis detailing your home's value as well as a comparison with similar homes in the area
Home Values in the Area
Average Home Value in this Area
Purchase History
| Date | Buyer | Sale Price | Title Company |
|---|---|---|---|
| Quinn Anthony | $318,000 | Land Title Inc | |
| Bensaad Johnson Nawal Soraya | $224,900 | The Title Group Inc | |
| Polden Brady R | $173,758 | -- | |
| The Rottlund Company | $52,654 | -- |
Source: Public Records
Mortgage History
| Date | Status | Borrower | Loan Amount |
|---|---|---|---|
| Open | Quinn Anthony | $291,208 | |
| Previous Owner | Bensaad Johnson Nawal Soraya | $179,920 |
Source: Public Records
Tax History Compared to Growth
Tax History
| Year | Tax Paid | Tax Assessment Tax Assessment Total Assessment is a certain percentage of the fair market value that is determined by local assessors to be the total taxable value of land and additions on the property. | Land | Improvement |
|---|---|---|---|---|
| 2025 | $4,422 | $428,300 | $108,100 | $320,200 |
| 2024 | $4,422 | $404,300 | $99,100 | $305,200 |
| 2023 | $4,040 | $407,900 | $99,100 | $308,800 |
| 2022 | $3,951 | $401,900 | $81,100 | $320,800 |
| 2021 | $3,797 | $342,300 | $71,000 | $271,300 |
| 2020 | $3,788 | $324,100 | $72,900 | $251,200 |
| 2019 | $3,575 | $309,500 | $65,000 | $244,500 |
| 2018 | $3,432 | $286,100 | $0 | $0 |
| 2017 | $3,133 | $267,900 | $0 | $0 |
| 2016 | $3,259 | $246,900 | $0 | $0 |
| 2015 | -- | $246,900 | $73,400 | $173,500 |
| 2014 | -- | $223,400 | $71,000 | $152,400 |
Source: Public Records
Map
Nearby Homes
- 1842 111th Ave NE
- 1824 111th Ave NE
- 1806 111th Ave NE
- 11505 Palisade Ct NE
- 11508 Arnold Palmer Dr
- 11030 Amen Cir NE
- 11316 Fergus St NE Unit E
- 11345 Fergus St NE Unit D
- 11132 Club West Cir Unit A
- 11125 Baltimore St NE Unit L
- 2464 Tournament Players Cir N
- 2535 110th Ct NE
- 11358 Chisholm Cir NE Unit E
- 1481 111th Ln NE Unit G
- 2634 Tournament Players Cir N
- 1635 117th Ave NE
- 11064 Zumbrota Ct NE
- 2255 119th Cir NE
- 2070 120th Ave NE
- 2348 119th Cir NE
- 2010 2010 112th-Circle-ne
- 2006 112th Cir NE
- 2002 112th Cir NE
- 2002 2002 112th-Circle-ne
- 2011 112th Cir NE
- 2005 112th Cir NE
- 1996 112th Cir NE
- 1999 112th Cir NE
- 11248 Nassau Cir NE
- 11238 Nassau Cir NE
- 11224 Nassau Cir NE
- 1994 112th Cir NE
- 1993 112th Cir NE
- 1993 1993 112th-Circle-ne
- 2008 112th Ct NE
- 2004 112th Ct NE
- 11212 Nassau Cir NE
- 1992 112th Cir NE
- 1987 112th Cir NE
- 11198 Nassau Cir NE