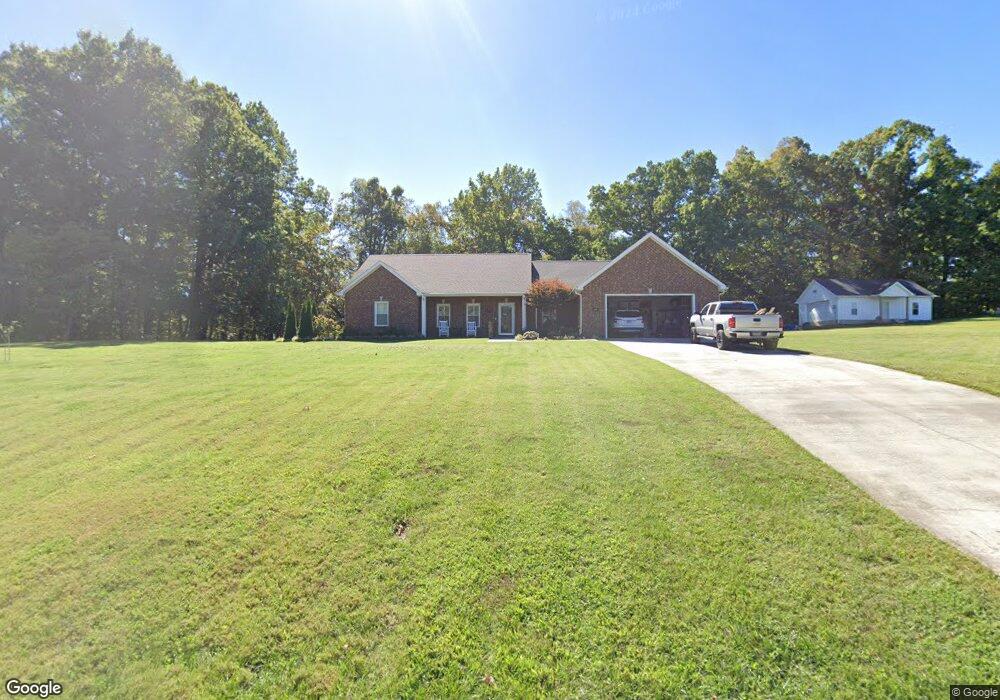
2010 Bear Creek Point Cookeville, TN 38506
Estimated Value: $434,091 - $543,000
4
Beds
2
Baths
2,650
Sq Ft
$188/Sq Ft
Est. Value
About This Home
This home is located at 2010 Bear Creek Point, Cookeville, TN 38506 and is currently estimated at $498,523, approximately $188 per square foot. 2010 Bear Creek Point is a home located in Putnam County with nearby schools including Cookeville High School, Algood Middle School, and Algood Elementary School.
Ownership History
Date
Name
Owned For
Owner Type
Purchase Details
Closed on
May 12, 2021
Sold by
Higgins Lena M
Bought by
Cupp Kevin F and Cupp Regina M
Current Estimated Value
Purchase Details
Closed on
Jan 13, 2015
Sold by
Montgomery Daniel
Bought by
Higgins Archie A Lena M
Home Financials for this Owner
Home Financials are based on the most recent Mortgage that was taken out on this home.
Original Mortgage
$180,000
Interest Rate
3.19%
Mortgage Type
New Conventional
Purchase Details
Closed on
Mar 18, 2010
Sold by
Hall James N
Bought by
Montgomery Daniel
Home Financials for this Owner
Home Financials are based on the most recent Mortgage that was taken out on this home.
Original Mortgage
$25,000
Interest Rate
4.91%
Purchase Details
Closed on
May 14, 2004
Bought by
Hall James N and Hall Coleen
Purchase Details
Closed on
May 30, 2000
Bought by
Thurman Ronald and Thurman Tina
Purchase Details
Closed on
May 1, 2000
Bought by
Martin Danny and Martin Kelly
Purchase Details
Closed on
May 25, 1982
Bought by
Robinson James T
Create a Home Valuation Report for This Property
The Home Valuation Report is an in-depth analysis detailing your home's value as well as a comparison with similar homes in the area
Home Values in the Area
Average Home Value in this Area
Purchase History
| Date | Buyer | Sale Price | Title Company |
|---|---|---|---|
| Cupp Kevin F | $335,000 | None Available | |
| Higgins Archie A Lena M | $225,000 | -- | |
| Montgomery Daniel | $50,000 | -- | |
| Hall James N | $96,500 | -- | |
| Thurman Ronald | $134,800 | -- | |
| Martin Danny | $361,300 | -- | |
| Robinson James T | -- | -- |
Source: Public Records
Mortgage History
| Date | Status | Borrower | Loan Amount |
|---|---|---|---|
| Previous Owner | Higgins Archie A Lena M | $180,000 | |
| Previous Owner | Robinson James T | $25,000 |
Source: Public Records
Tax History Compared to Growth
Tax History
| Year | Tax Paid | Tax Assessment Tax Assessment Total Assessment is a certain percentage of the fair market value that is determined by local assessors to be the total taxable value of land and additions on the property. | Land | Improvement |
|---|---|---|---|---|
| 2024 | $2,280 | $85,700 | $10,125 | $75,575 |
| 2023 | $2,280 | $85,700 | $10,125 | $75,575 |
| 2022 | $1,921 | $77,700 | $10,125 | $67,575 |
| 2021 | $1,870 | $77,700 | $10,125 | $67,575 |
| 2020 | $1,720 | $75,650 | $8,075 | $67,575 |
| 2019 | $1,720 | $58,775 | $8,075 | $50,700 |
| 2018 | $1,605 | $58,775 | $8,075 | $50,700 |
| 2017 | $1,605 | $58,775 | $8,075 | $50,700 |
| 2016 | $1,605 | $58,775 | $8,075 | $50,700 |
| 2015 | $1,649 | $58,775 | $8,075 | $50,700 |
| 2014 | $1,629 | $58,084 | $0 | $0 |
Source: Public Records
Map
Nearby Homes
- 2035 Bear Creek Point
- 0 Bear Creek Cir
- 3435 Northwind Dr
- 3429 Wj Robinson Rd
- 1916 Bear Creek Point
- 1663 Paran Rd
- 902 Evelyn Ct
- 5004 Curtis Way
- 1081 Cynthia St
- 3011 Zeb Warren Rd
- 5898 Hilham Rd
- 4887 Hilham Rd
- 3006 Deerhaven Dr N
- 2908 Deerhaven Dr S
- 6538 6538 Hilham Rd
- 6538 Hilham Rd
- 4201 Mirandy Rd
- 000 Mirandy Rd
- 2010 Bear Creek Pointe
- 2018 Bear Creek Point
- 2019 Bear Creek Point
- 2026 Bear Creek Point
- 2023 Bear Creek Point
- 1992 Bear Creek Pointe
- 1992 Bear Creek Point
- 2022 Bear Creek Cir
- 2022 Bear Creek Point
- 1989 Bear Creek Point
- 2034 Bear Creek Point
- 1988 Bear Creek Point
- 2001 Bear Creek Cir
- 1985 Bear Creek Point
- 1985 Bear Creek Point
- 1984 Bear Creek Point
- 2040 Bear Creek Point
- 1981 Bear Creek Point
- 2041 Bear Creek Point
- 1981 Bear Creek