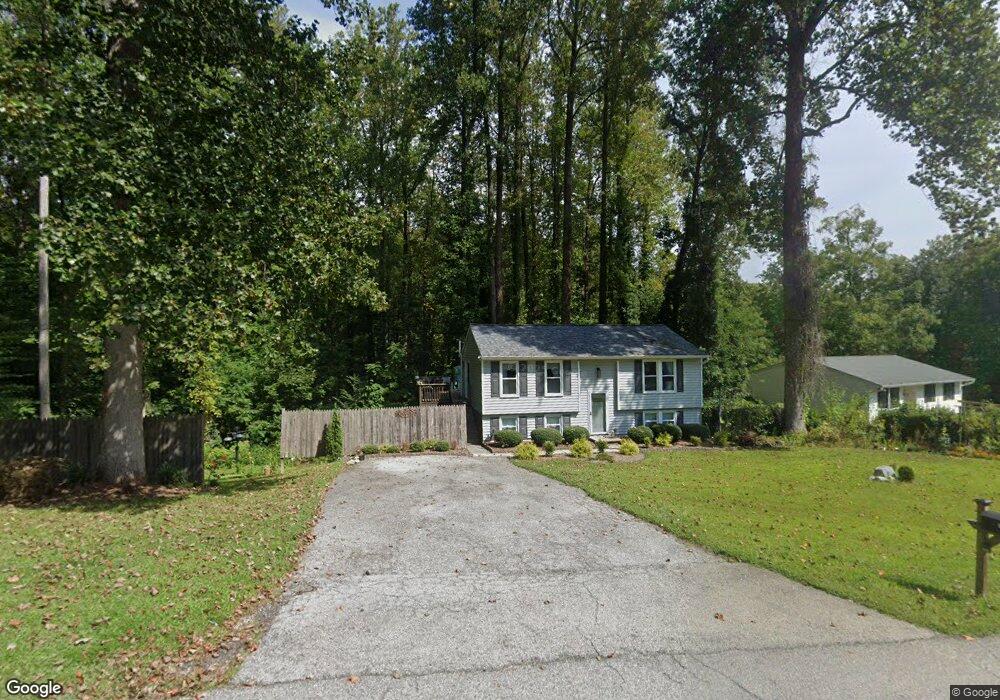
2010 Boyds Trail Owings, MD 20736
Estimated Value: $336,262 - $467,000
3
Beds
2
Baths
828
Sq Ft
$472/Sq Ft
Est. Value
About This Home
This home is located at 2010 Boyds Trail, Owings, MD 20736 and is currently estimated at $390,816, approximately $472 per square foot. 2010 Boyds Trail is a home located in Calvert County with nearby schools including Windy Hill Elementary School, Windy Hill Middle School, and Northern High School.
Ownership History
Date
Name
Owned For
Owner Type
Purchase Details
Closed on
Nov 14, 2014
Sold by
Fowler Brenda J
Bought by
Smith Michael and Smith Christine
Current Estimated Value
Home Financials for this Owner
Home Financials are based on the most recent Mortgage that was taken out on this home.
Original Mortgage
$243,182
Interest Rate
4.4%
Mortgage Type
FHA
Purchase Details
Closed on
Jun 30, 2004
Sold by
Forgan David Michael and Forgan Ruth M
Bought by
Fowler Brenda J
Purchase Details
Closed on
Jun 17, 2002
Sold by
Forgan David Michael
Bought by
Forgan David Michael and Forgan Ruth M
Purchase Details
Closed on
Jan 22, 1998
Sold by
Hunter John A and Hunter Joy D
Bought by
Forgan David Michael
Purchase Details
Closed on
May 30, 1997
Sold by
Hunter John A
Bought by
Hunter John A and Hunter Joy D
Create a Home Valuation Report for This Property
The Home Valuation Report is an in-depth analysis detailing your home's value as well as a comparison with similar homes in the area
Home Values in the Area
Average Home Value in this Area
Purchase History
| Date | Buyer | Sale Price | Title Company |
|---|---|---|---|
| Smith Michael | $250,000 | None Available | |
| Fowler Brenda J | $275,000 | -- | |
| Forgan David Michael | -- | -- | |
| Forgan David Michael | $140,000 | -- | |
| Hunter John A | -- | -- |
Source: Public Records
Mortgage History
| Date | Status | Borrower | Loan Amount |
|---|---|---|---|
| Previous Owner | Smith Michael | $243,182 | |
| Closed | Forgan David Michael | -- |
Source: Public Records
Tax History Compared to Growth
Tax History
| Year | Tax Paid | Tax Assessment Tax Assessment Total Assessment is a certain percentage of the fair market value that is determined by local assessors to be the total taxable value of land and additions on the property. | Land | Improvement |
|---|---|---|---|---|
| 2025 | $3,368 | $291,600 | $150,700 | $140,900 |
| 2024 | $3,224 | $278,667 | $0 | $0 |
| 2023 | $2,975 | $265,733 | $0 | $0 |
| 2022 | $2,838 | $252,800 | $150,700 | $102,100 |
| 2021 | $2,781 | $249,767 | $0 | $0 |
| 2020 | $2,781 | $246,733 | $0 | $0 |
| 2019 | $2,758 | $243,700 | $150,700 | $93,000 |
| 2018 | $2,710 | $240,333 | $0 | $0 |
| 2017 | $2,707 | $236,967 | $0 | $0 |
| 2016 | -- | $233,600 | $0 | $0 |
| 2015 | $2,537 | $233,600 | $0 | $0 |
| 2014 | $2,537 | $233,600 | $0 | $0 |
Source: Public Records
Map
Nearby Homes
- 254 Friendship Rd
- 1651 Paris Oaks Rd
- 9230 Sam Owings Place
- 175 Tucker Ct
- 8815 Falling Leaf Dr
- 8986 Chesapeake Lighthouse Dr
- 2050 Horace Ward Rd
- 3600 4th St
- 8741 Paris Pines Ct
- 8814 Lafayette Dr
- 634 Alabama Ave
- 3813 8th St
- 8922 Louisville Ave
- 60 Friendship Rd
- 8910 Louisville Ave
- 3757 Bedford Dr
- 9420 Sea Breeze Ct
- 3761 Bedford Dr
- 520 E Chesapeake Beach Rd
- 668 Walnut Ave
- 2014 Boyds Trail
- 2013 Boyds Trail
- 2011 Boyds Trail
- 2017 Boyds Trail
- 2006 Boyds Trail
- 2022 Boyds Trail
- 2009 Boyds Trail
- 2016 Boyds Trail
- 2007 Boyds Trail
- 2021 Boyds Trail
- 2028 Boyds Trail
- 9969 Boyds Turn Rd
- 2002 Boyds Trail
- 2003 Boyds Trail
- 2018 Boyds Trail
- 2026 Boyds Trail
- 9957 Boyds Turn Rd
- 9967 Boyds Turn Rd
- 2025 Boyds Trail
- 2020 Boyds Trail