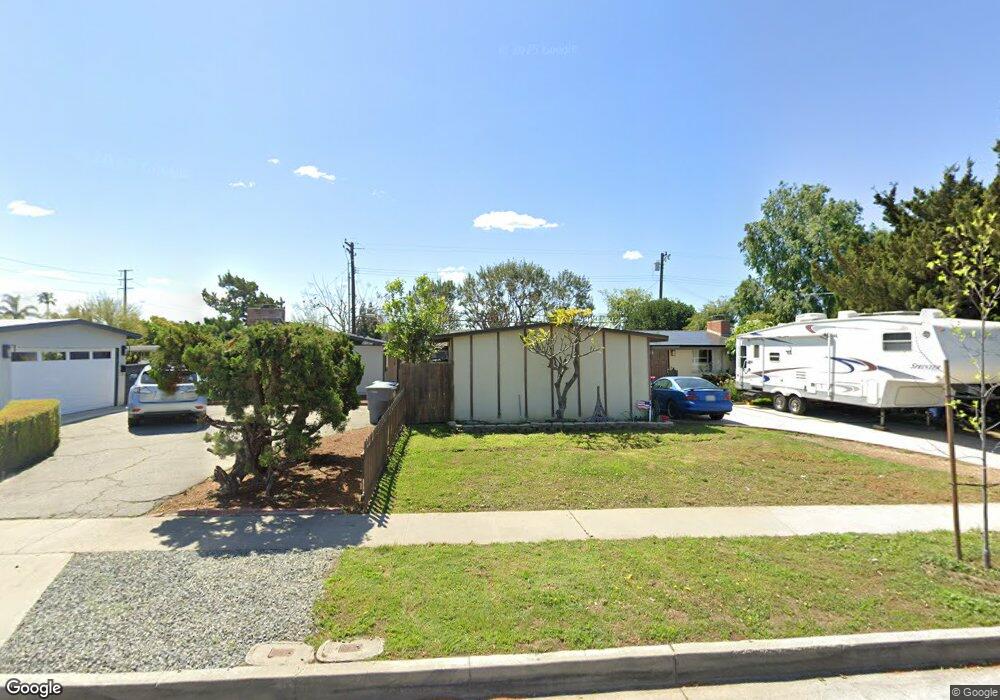
2010 Gregory Ln La Habra, CA 90631
Estimated Value: $763,000 - $1,058,000
2
Beds
2
Baths
1,261
Sq Ft
$685/Sq Ft
Est. Value
About This Home
This home is located at 2010 Gregory Ln, La Habra, CA 90631 and is currently estimated at $864,091, approximately $685 per square foot. 2010 Gregory Ln is a home located in Orange County with nearby schools including Jordan Elementary School, Rancho-Starbuck Intermediate School, and La Habra High School.
Ownership History
Date
Name
Owned For
Owner Type
Purchase Details
Closed on
Jul 30, 2018
Sold by
Johnson Rick D
Bought by
Johnson Jeremy Dean and Johnson Rachel
Current Estimated Value
Home Financials for this Owner
Home Financials are based on the most recent Mortgage that was taken out on this home.
Original Mortgage
$378,000
Outstanding Balance
$326,907
Interest Rate
4.5%
Mortgage Type
New Conventional
Estimated Equity
$537,184
Purchase Details
Closed on
Jul 20, 2018
Sold by
Johnson Sherry Ann and Johnson Ricki
Bought by
Johnson Rick D
Home Financials for this Owner
Home Financials are based on the most recent Mortgage that was taken out on this home.
Original Mortgage
$378,000
Outstanding Balance
$326,907
Interest Rate
4.5%
Mortgage Type
New Conventional
Estimated Equity
$537,184
Purchase Details
Closed on
Oct 18, 2000
Sold by
Chadwick Kathryn M
Bought by
Chadwick William L and Chadwick Kathryn M
Purchase Details
Closed on
Oct 22, 1997
Sold by
Chadwick Kathryn N and Chadwick William William
Bought by
Chadwick William L and Chadwick Kathryn M
Create a Home Valuation Report for This Property
The Home Valuation Report is an in-depth analysis detailing your home's value as well as a comparison with similar homes in the area
Home Values in the Area
Average Home Value in this Area
Purchase History
| Date | Buyer | Sale Price | Title Company |
|---|---|---|---|
| Johnson Jeremy Dean | $540,000 | California Title Co | |
| Johnson Rick D | -- | None Available | |
| Chadwick William L | -- | -- | |
| Chadwick Kathryn M | -- | -- | |
| Chadwick William L | -- | -- |
Source: Public Records
Mortgage History
| Date | Status | Borrower | Loan Amount |
|---|---|---|---|
| Open | Johnson Jeremy Dean | $378,000 |
Source: Public Records
Tax History Compared to Growth
Tax History
| Year | Tax Paid | Tax Assessment Tax Assessment Total Assessment is a certain percentage of the fair market value that is determined by local assessors to be the total taxable value of land and additions on the property. | Land | Improvement |
|---|---|---|---|---|
| 2025 | $1,114 | $68,626 | $26,992 | $41,634 |
| 2024 | $1,114 | $67,281 | $26,463 | $40,818 |
| 2023 | $1,084 | $65,962 | $25,944 | $40,018 |
| 2022 | $1,067 | $64,669 | $25,435 | $39,234 |
| 2021 | $1,048 | $63,401 | $24,936 | $38,465 |
| 2020 | $1,043 | $62,751 | $24,680 | $38,071 |
| 2019 | $1,026 | $61,521 | $24,196 | $37,325 |
| 2018 | $920 | $60,315 | $23,721 | $36,594 |
| 2017 | $904 | $59,133 | $23,256 | $35,877 |
| 2016 | $886 | $57,974 | $22,800 | $35,174 |
| 2015 | $864 | $57,104 | $22,458 | $34,646 |
| 2014 | $839 | $55,986 | $22,018 | $33,968 |
Source: Public Records
Map
Nearby Homes
- 2100 Gregory Ln
- 1620 W El Portal Dr
- 401 Granada Dr
- 2611 Gregory Ln
- 240 Oakland Dr
- 16540 Whittier Blvd
- 16621 Crape Myrtle Ln
- 1921 Pine Dr
- 9331 Mikinda Ave
- 421 N Marian St
- 530 Spruce Way
- 9422 Canfield Dr
- 2641 Stanton Ave
- 2311 Canfield Dr
- 2000 Baja Ave
- 2401 Canfield Dr
- 1675 W Lambert Rd Unit 22
- 334 E William Way
- 320 -330 Monte Vista
- 322 E William Way
- 2020 Gregory Ln
- 2000 Gregory Ln
- 2030 Gregory Ln
- 2011 Gregory Ln
- 2001 Gregory Ln
- 2021 Gregory Ln
- 2040 Gregory Ln
- 630 Chantry Dr
- 541 La Cadena Way
- 2010 Rio Verde Dr
- 2101 Gregory Ln
- 2020 Rio Verde Dr
- 2000 Rio Verde Dr
- 531 La Cadena Way Unit 4
- 2110 Gregory Ln
- 640 Chantry Dr
- 511 La Cadena Way
- 631 Chantry Dr
- 2120 Gregory Ln
- 501 La Cadena Way