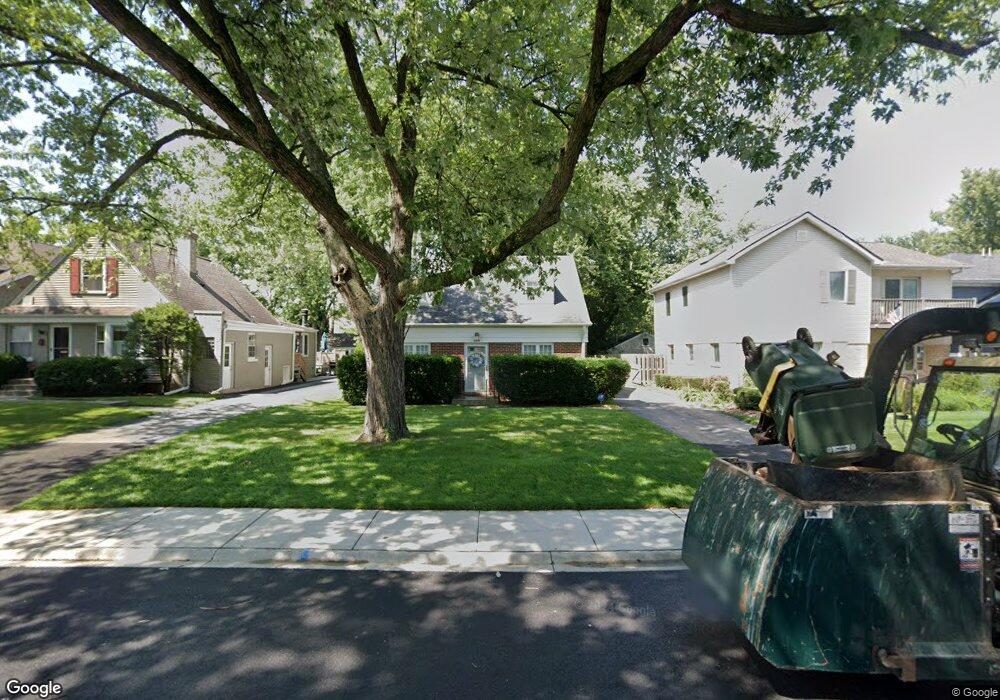
2010 Linneman St Glenview, IL 60025
Estimated Value: $733,000 - $876,000
3
Beds
2
Baths
1,838
Sq Ft
$435/Sq Ft
Est. Value
About This Home
This home is located at 2010 Linneman St, Glenview, IL 60025 and is currently estimated at $798,941, approximately $434 per square foot. 2010 Linneman St is a home located in Cook County with nearby schools including Hoffman Elementary School, Henking Elementary School, and Springman Middle School.
Ownership History
Date
Name
Owned For
Owner Type
Purchase Details
Closed on
Sep 8, 2016
Sold by
Lake Jonathan M and Harthan Lake Jennifer S
Bought by
Harthan Lake Jennifer S and Lake Jonathan M
Current Estimated Value
Purchase Details
Closed on
Jul 24, 2008
Sold by
Lake Steven A
Bought by
Lake Jonathan M and Harthan Jennifer S
Home Financials for this Owner
Home Financials are based on the most recent Mortgage that was taken out on this home.
Original Mortgage
$320,000
Outstanding Balance
$209,765
Interest Rate
6.39%
Mortgage Type
Purchase Money Mortgage
Estimated Equity
$589,176
Purchase Details
Closed on
Mar 22, 2004
Sold by
Lake Steven A
Bought by
Lake Steven A and Steven A Lake 2004 Trust
Create a Home Valuation Report for This Property
The Home Valuation Report is an in-depth analysis detailing your home's value as well as a comparison with similar homes in the area
Home Values in the Area
Average Home Value in this Area
Purchase History
| Date | Buyer | Sale Price | Title Company |
|---|---|---|---|
| Harthan Lake Jennifer S | -- | Attorney | |
| Lake Jonathan M | $400,000 | First American Title Ins Co | |
| Lake Steven A | -- | -- |
Source: Public Records
Mortgage History
| Date | Status | Borrower | Loan Amount |
|---|---|---|---|
| Open | Lake Jonathan M | $320,000 |
Source: Public Records
Tax History Compared to Growth
Tax History
| Year | Tax Paid | Tax Assessment Tax Assessment Total Assessment is a certain percentage of the fair market value that is determined by local assessors to be the total taxable value of land and additions on the property. | Land | Improvement |
|---|---|---|---|---|
| 2024 | $12,989 | $62,000 | $14,800 | $47,200 |
| 2023 | $12,600 | $62,000 | $14,800 | $47,200 |
| 2022 | $12,600 | $62,000 | $14,800 | $47,200 |
| 2021 | $9,353 | $40,908 | $11,331 | $29,577 |
| 2020 | $9,298 | $40,908 | $11,331 | $29,577 |
| 2019 | $8,661 | $44,954 | $11,331 | $33,623 |
| 2018 | $10,208 | $47,818 | $9,943 | $37,875 |
| 2017 | $9,949 | $47,818 | $9,943 | $37,875 |
| 2016 | $9,587 | $47,818 | $9,943 | $37,875 |
| 2015 | $8,201 | $37,060 | $8,093 | $28,967 |
| 2014 | $8,063 | $37,060 | $8,093 | $28,967 |
| 2013 | $7,804 | $37,060 | $8,093 | $28,967 |
Source: Public Records
Map
Nearby Homes
- 2137 Glenview Rd
- 1800 Dewes St Unit 305
- 1800 Dewes St Unit 201
- 1800 Dewes St Unit 309
- 517 Briarhill Ln
- 1821 George Ct
- 2121 Fir St
- 1220 Depot St Unit 305
- 1220 Depot St Unit 109
- 1220 Depot St Unit 409
- 609 Carriage Hill Dr
- 315 Lincoln St
- 711 Carriage Hill Dr
- 713 Carriage Hill Dr
- 601 Carriage Hill Dr
- 1088 Shermer Rd Unit DW
- 1752 Maclean Ct
- 245 Nora Ave
- 1341 Greenwillow Ln Unit C
- 2014 Linneman St
- 2006 Linneman St
- 2018 Linneman St
- 2000 Linneman St
- 2022 Linneman St
- 2011 Henley St
- 2015 Henley St
- 2005 Henley St
- 2017 Henley St
- 2001 Henley St
- 2028 Linneman St
- 1964 Linneman St
- 2007 Linneman St
- 2013 Linneman St
- 2023 Henley St
- 2001 Linneman St
- 2019 Linneman St
- 2027 Henley St
- 1965 Henley St
- 2025 Linneman St