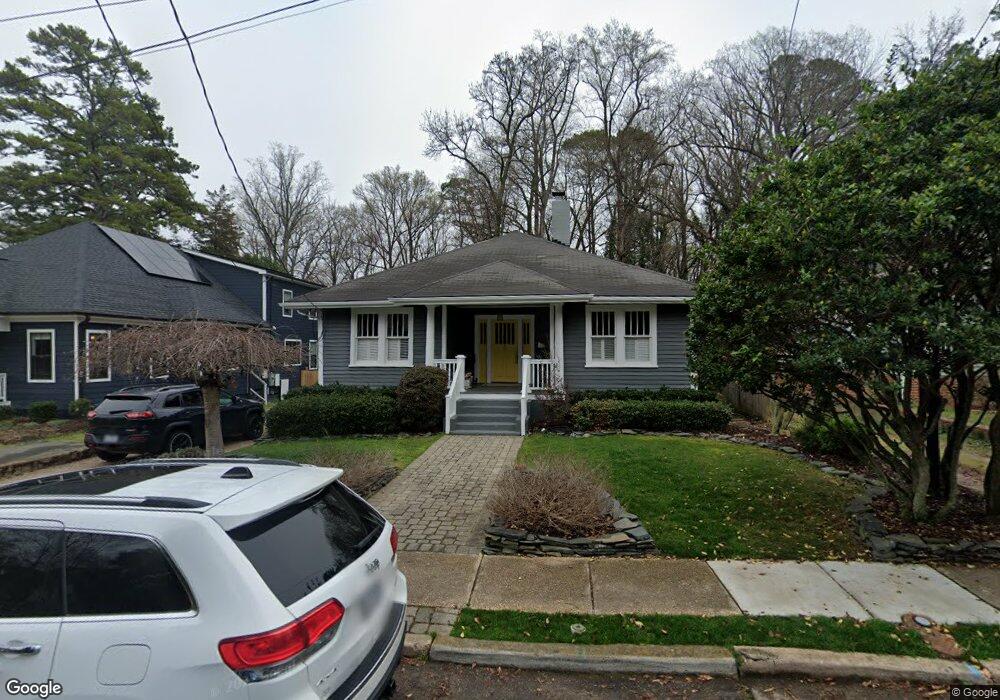
2010 Mccarthy St Raleigh, NC 27608
Five Points NeighborhoodEstimated Value: $880,000 - $958,000
3
Beds
2
Baths
1,729
Sq Ft
$532/Sq Ft
Est. Value
About This Home
This home is located at 2010 Mccarthy St, Raleigh, NC 27608 and is currently estimated at $919,587, approximately $531 per square foot. 2010 Mccarthy St is a home located in Wake County with nearby schools including Joyner Elementary School, Oberlin Middle School, and Broughton Magnet High School.
Ownership History
Date
Name
Owned For
Owner Type
Purchase Details
Closed on
Jul 17, 2019
Sold by
Mccroy William P and Mccrory Jacqueline A
Bought by
Mason Jeremy and Mansbach Cassandra
Current Estimated Value
Home Financials for this Owner
Home Financials are based on the most recent Mortgage that was taken out on this home.
Original Mortgage
$484,800
Outstanding Balance
$424,553
Interest Rate
3.8%
Mortgage Type
New Conventional
Estimated Equity
$495,034
Purchase Details
Closed on
Nov 13, 1998
Sold by
Koger Christine B
Bought by
Mccrory William P and Mccrory Jacqueline A
Home Financials for this Owner
Home Financials are based on the most recent Mortgage that was taken out on this home.
Original Mortgage
$156,750
Interest Rate
6.58%
Create a Home Valuation Report for This Property
The Home Valuation Report is an in-depth analysis detailing your home's value as well as a comparison with similar homes in the area
Home Values in the Area
Average Home Value in this Area
Purchase History
| Date | Buyer | Sale Price | Title Company |
|---|---|---|---|
| Mason Jeremy | $606,000 | None Available | |
| Mccrory William P | $165,000 | -- |
Source: Public Records
Mortgage History
| Date | Status | Borrower | Loan Amount |
|---|---|---|---|
| Open | Mason Jeremy | $484,800 | |
| Previous Owner | Mccrory William P | $156,750 |
Source: Public Records
Tax History Compared to Growth
Tax History
| Year | Tax Paid | Tax Assessment Tax Assessment Total Assessment is a certain percentage of the fair market value that is determined by local assessors to be the total taxable value of land and additions on the property. | Land | Improvement |
|---|---|---|---|---|
| 2025 | $7,533 | $861,489 | $618,750 | $242,739 |
| 2024 | $7,502 | $861,489 | $618,750 | $242,739 |
| 2023 | $6,965 | $637,162 | $418,000 | $219,162 |
| 2022 | $6,471 | $637,162 | $418,000 | $219,162 |
| 2021 | $6,220 | $637,162 | $418,000 | $219,162 |
| 2020 | $6,106 | $637,162 | $418,000 | $219,162 |
| 2019 | $6,098 | $524,422 | $313,500 | $210,922 |
| 2018 | $5,750 | $524,422 | $313,500 | $210,922 |
| 2017 | $5,476 | $524,422 | $313,500 | $210,922 |
| 2016 | $5,363 | $524,422 | $313,500 | $210,922 |
| 2015 | $5,613 | $540,113 | $283,075 | $257,038 |
| 2014 | $5,323 | $540,113 | $283,075 | $257,038 |
Source: Public Records
Map
Nearby Homes
- 110 Hudson St
- 106 E Whitaker Mill Rd Unit A
- 204 E Whitaker Mill Rd
- 208 E Whitaker Mill Rd
- 1902 Glenwood Ave
- 2404 Beechridge Rd
- 2124 Fallon Oaks Ct
- 203 W West Roanoke Park Dr
- 2015 Fairview Rd Unit 200
- 1608 Scales St
- 2328 Byrd St
- 1606 Scales St
- 2605 Hazelwood Dr
- 2609 Hazelwood Dr
- 1610 Carson St
- 1527 Urban Trace Ln
- 1525 Urban Trace Ln
- 1523 1/2 Sunrise Ave
- 1523 Sunrise Ave
- 1523 Urban Trace Ln
- 2008 Mccarthy St
- 2012 Mccarthy St
- 2006 Mccarthy St
- 2200 Alexander Rd
- 2202 Alexander Rd
- 2013 Mccarthy St
- 101 Hudson St
- 107 Hudson St
- 2204 Alexander Rd
- 109 Hudson St
- 2009 Mccarthy St
- 2011 Mccarthy St
- 2005 Mccarthy St
- 2011 Alexander Rd
- 111 Hudson St
- 2206 Alexander Rd
- 2205 Alexander Rd
- 2004 Alexander Rd
- 113 Hudson St
- 2001 Mccarthy St