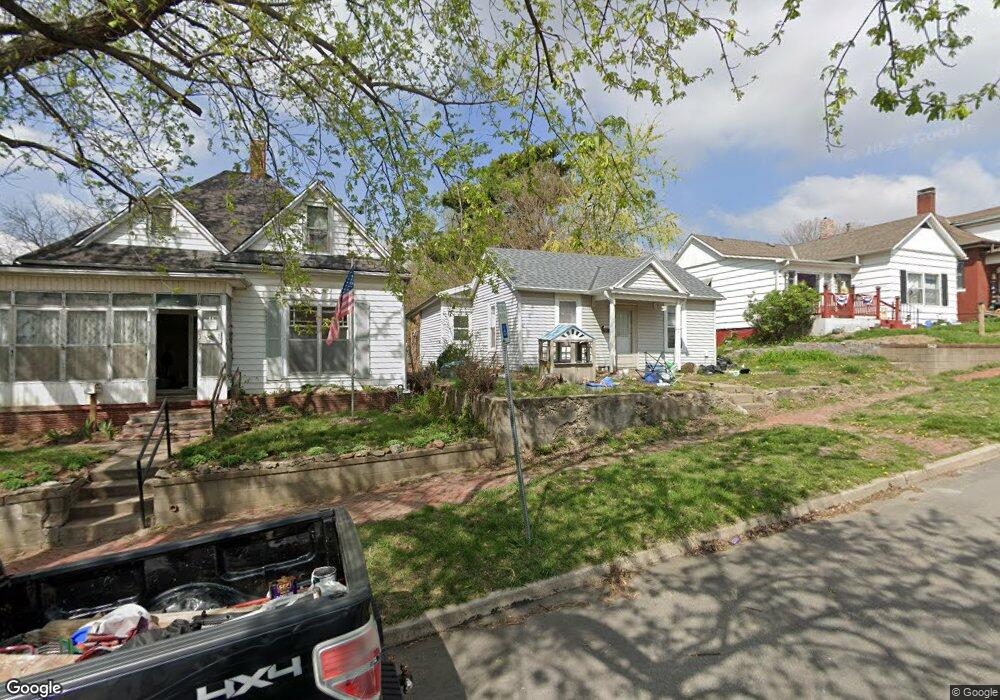
2010 N 3 St Saint Joseph, MO 64505
Northside NeighborhoodEstimated Value: $83,000 - $100,000
2
Beds
1
Bath
904
Sq Ft
$101/Sq Ft
Est. Value
About This Home
This home is located at 2010 N 3 St, Saint Joseph, MO 64505 and is currently estimated at $91,445, approximately $101 per square foot. 2010 N 3 St is a home located in Buchanan County with nearby schools including Lindbergh Elementary School, Robidoux Middle School, and Lafayette High School.
Ownership History
Date
Name
Owned For
Owner Type
Purchase Details
Closed on
Aug 28, 2018
Sold by
Johnson Jese T and Johnson Shea
Bought by
Johnson Jesse T and Johnson Shea
Current Estimated Value
Purchase Details
Closed on
Apr 16, 2010
Sold by
Drennen Henry S and Drennen Gloria C
Bought by
Johnson Jesse T
Home Financials for this Owner
Home Financials are based on the most recent Mortgage that was taken out on this home.
Original Mortgage
$36,900
Outstanding Balance
$24,455
Interest Rate
4.9%
Mortgage Type
Future Advance Clause Open End Mortgage
Estimated Equity
$66,990
Create a Home Valuation Report for This Property
The Home Valuation Report is an in-depth analysis detailing your home's value as well as a comparison with similar homes in the area
Home Values in the Area
Average Home Value in this Area
Purchase History
| Date | Buyer | Sale Price | Title Company |
|---|---|---|---|
| Johnson Jesse T | -- | Nations Title | |
| Johnson Jesse T | -- | St Joseph Title & Abstract C |
Source: Public Records
Mortgage History
| Date | Status | Borrower | Loan Amount |
|---|---|---|---|
| Open | Johnson Jesse T | $36,900 |
Source: Public Records
Tax History Compared to Growth
Tax History
| Year | Tax Paid | Tax Assessment Tax Assessment Total Assessment is a certain percentage of the fair market value that is determined by local assessors to be the total taxable value of land and additions on the property. | Land | Improvement |
|---|---|---|---|---|
| 2024 | $340 | $4,740 | $810 | $3,930 |
| 2023 | $340 | $4,740 | $810 | $3,930 |
| 2022 | $313 | $4,740 | $810 | $3,930 |
| 2021 | $315 | $4,740 | $810 | $3,930 |
| 2020 | $313 | $4,740 | $810 | $3,930 |
| 2019 | $302 | $4,740 | $810 | $3,930 |
| 2018 | $273 | $4,740 | $810 | $3,930 |
| 2017 | $270 | $4,740 | $0 | $0 |
| 2015 | $0 | $4,740 | $0 | $0 |
| 2014 | $296 | $4,740 | $0 | $0 |
Source: Public Records
Map
Nearby Homes