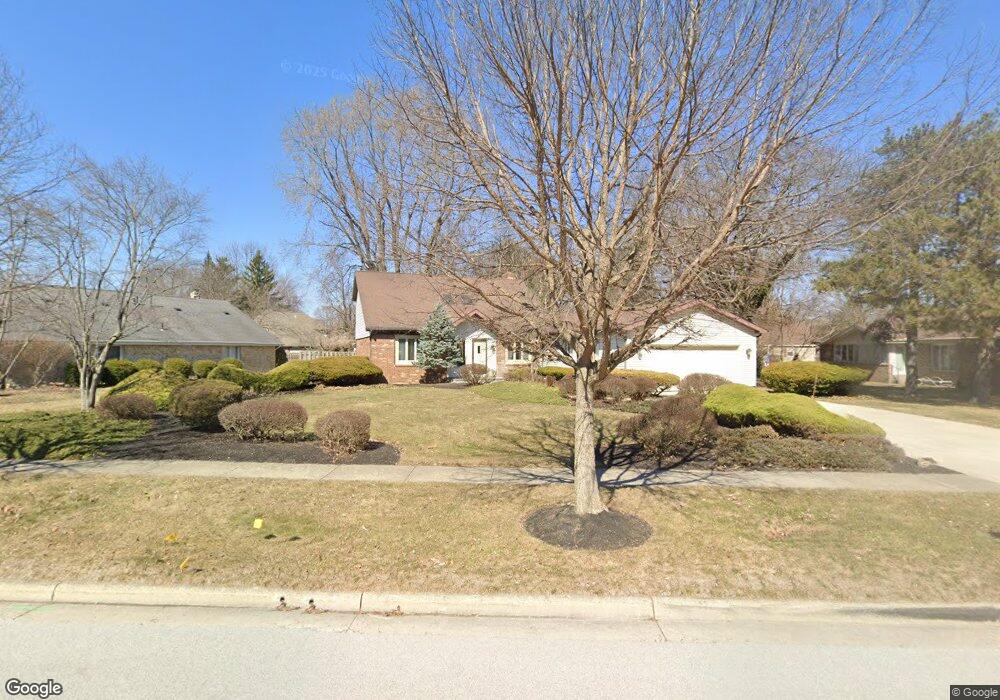
2010 Old Mill Rd Findlay, OH 45840
Estimated Value: $362,273 - $394,000
3
Beds
3
Baths
2,460
Sq Ft
$155/Sq Ft
Est. Value
About This Home
This home is located at 2010 Old Mill Rd, Findlay, OH 45840 and is currently estimated at $382,068, approximately $155 per square foot. 2010 Old Mill Rd is a home located in Hancock County with nearby schools including Wilson Vance Elementary School, Whittier Elementary School, and Glenwood Middle School.
Ownership History
Date
Name
Owned For
Owner Type
Purchase Details
Closed on
Oct 7, 2004
Sold by
Browne Joan Uhl
Bought by
Browne Clifford E
Current Estimated Value
Home Financials for this Owner
Home Financials are based on the most recent Mortgage that was taken out on this home.
Original Mortgage
$84,500
Interest Rate
5.89%
Mortgage Type
New Conventional
Purchase Details
Closed on
Apr 27, 1987
Bought by
Browne Clifford E and Browne Joan
Purchase Details
Closed on
Dec 7, 1984
Bought by
Browne Clifford E
Purchase Details
Closed on
Nov 26, 1984
Bought by
Equitable Relocation
Purchase Details
Closed on
Aug 31, 1981
Bought by
Peiffer Garry L and Peiffer Kathleen
Purchase Details
Closed on
May 18, 1981
Bought by
Equitable Life Assurance
Create a Home Valuation Report for This Property
The Home Valuation Report is an in-depth analysis detailing your home's value as well as a comparison with similar homes in the area
Home Values in the Area
Average Home Value in this Area
Purchase History
| Date | Buyer | Sale Price | Title Company |
|---|---|---|---|
| Browne Clifford E | -- | Mid Am Title | |
| Browne Clifford E | -- | -- | |
| Browne Clifford E | $119,000 | -- | |
| Equitable Relocation | -- | -- | |
| Peiffer Garry L | -- | -- | |
| Equitable Life Assurance | -- | -- |
Source: Public Records
Mortgage History
| Date | Status | Borrower | Loan Amount |
|---|---|---|---|
| Closed | Browne Clifford E | $84,500 |
Source: Public Records
Tax History
| Year | Tax Paid | Tax Assessment Tax Assessment Total Assessment is a certain percentage of the fair market value that is determined by local assessors to be the total taxable value of land and additions on the property. | Land | Improvement |
|---|---|---|---|---|
| 2024 | $3,635 | $102,320 | $13,760 | $88,560 |
| 2023 | $3,640 | $102,320 | $13,760 | $88,560 |
| 2022 | $3,628 | $102,320 | $13,760 | $88,560 |
| 2021 | $3,527 | $86,650 | $13,200 | $73,450 |
| 2020 | $3,526 | $86,650 | $13,200 | $73,450 |
| 2019 | $3,455 | $86,650 | $13,200 | $73,450 |
| 2018 | $3,476 | $79,980 | $13,200 | $66,780 |
| 2017 | $1,739 | $79,980 | $13,200 | $66,780 |
| 2016 | $3,418 | $79,980 | $13,200 | $66,780 |
| 2015 | $3,484 | $79,690 | $13,200 | $66,490 |
| 2014 | $3,485 | $79,690 | $13,200 | $66,490 |
| 2012 | $3,478 | $79,020 | $13,200 | $65,820 |
Source: Public Records
Map
Nearby Homes
- 2000 Rush Creek Ct
- 2245 Fox Run Cir Unit 1037
- 1121 Fox Run Rd
- 1825 Greendale Ave
- 801 Fox Run Rd
- 821 Fox Run Rd Unit 6
- 1926 Queenswood Dr
- 456 Strathaven Dr
- 845 Fox Run Rd
- 631 Winterhaven Dr
- 1828 Queenswood Dr
- 1724 Queenswood Dr Unit 10 (2-C)
- 701 Red Fox Rd
- 1421 E Sandusky St
- 1421 Autumn Dr
- 1521 Middle Ct
- 100 Warrington Ave
- 827 Abbey Ln
- 1203 Chateau Ct
- 309 Huron Rd
- 400 Westchester Dr
- 2000 Old Mill Rd
- 2130 Windsor Place
- 2130 Windsor Place
- 414 Westchester Dr
- 0 Old Mill Rd
- 2011 Old Mill Rd
- 420 Westchester Dr
- 2001 Old Mill Rd
- 2021 Old Mill Rd
- 407 Westchester Dr
- 2141 Windsor Place
- 1999 Old Mill Rd
- 415 Westchester Dr
- 2121 Windsor Place
- 426 Westchester Dr
- 421 Bright Rd
- 2033 Old Mill Rd
- 401 Bright Rd
- 425 Westchester Dr
Your Personal Tour Guide
Ask me questions while you tour the home.