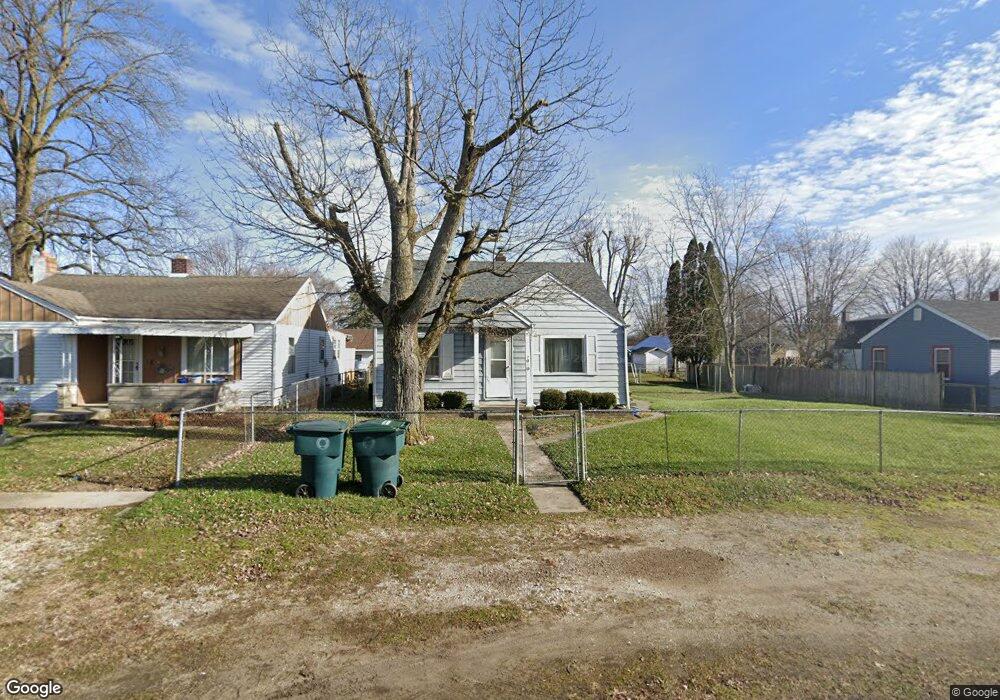
2010 S Shipley St Muncie, IN 47302
Southside NeighborhoodEstimated Value: $74,000 - $95,000
3
Beds
1
Bath
1,568
Sq Ft
$53/Sq Ft
Est. Value
About This Home
This home is located at 2010 S Shipley St, Muncie, IN 47302 and is currently estimated at $83,797, approximately $53 per square foot. 2010 S Shipley St is a home located in Delaware County with nearby schools including Grissom Memorial Elementary School, Muncie Central High School, and Southside Middle School.
Ownership History
Date
Name
Owned For
Owner Type
Purchase Details
Closed on
Aug 24, 2005
Sold by
G & T Properns Llc
Bought by
Allred Charles W and Allred Sharon K
Current Estimated Value
Home Financials for this Owner
Home Financials are based on the most recent Mortgage that was taken out on this home.
Original Mortgage
$63,000
Outstanding Balance
$33,392
Interest Rate
5.8%
Mortgage Type
New Conventional
Estimated Equity
$50,405
Create a Home Valuation Report for This Property
The Home Valuation Report is an in-depth analysis detailing your home's value as well as a comparison with similar homes in the area
Home Values in the Area
Average Home Value in this Area
Purchase History
| Date | Buyer | Sale Price | Title Company |
|---|---|---|---|
| Allred Charles W | -- | None Available |
Source: Public Records
Mortgage History
| Date | Status | Borrower | Loan Amount |
|---|---|---|---|
| Open | Allred Charles W | $63,000 |
Source: Public Records
Tax History Compared to Growth
Tax History
| Year | Tax Paid | Tax Assessment Tax Assessment Total Assessment is a certain percentage of the fair market value that is determined by local assessors to be the total taxable value of land and additions on the property. | Land | Improvement |
|---|---|---|---|---|
| 2024 | $595 | $47,700 | $3,600 | $44,100 |
| 2023 | $595 | $47,700 | $3,600 | $44,100 |
| 2022 | $446 | $37,900 | $3,600 | $34,300 |
| 2021 | $438 | $35,800 | $4,500 | $31,300 |
| 2020 | $526 | $43,300 | $4,500 | $38,800 |
| 2019 | $515 | $43,300 | $4,500 | $38,800 |
| 2018 | $489 | $43,300 | $4,500 | $38,800 |
| 2017 | $480 | $42,800 | $4,500 | $38,300 |
| 2016 | $471 | $41,000 | $4,500 | $36,500 |
| 2014 | $372 | $40,000 | $4,500 | $35,500 |
| 2013 | -- | $39,700 | $4,500 | $35,200 |
Source: Public Records
Map
Nearby Homes
- 2210 S Penn St
- 1304 S Shipley St
- 1303 S Shipley St
- 2112 S Beacon St
- 1511 E 20th St
- 1805 E 20th St
- 2304 S Meeker Ave
- 1511 S Meeker Ave
- 1202 S Shipley St
- 1407 S Meeker Ave
- 2115 S Ebright St
- 1118 S Walling Ave
- 2207 E Sharon Dr
- 1921 S Hackley St
- 2628 S Meeker Ave
- 1401 S Emerson Ct
- 2715 S Meeker Ave
- 1914 E 23rd St
- 2717 S Meeker Ave
- 2312 E 22nd St
- 2008 S Shipley St
- 2014 S Shipley St
- 2016 S Shipley St
- 2003 S Brotherton St
- 1801 E 13th St
- 1807 E 13th St
- 2007 S Brotherton St
- 2009 S Shipley St
- 2007 S Shipley St
- 2009 S Brotherton St
- 2020 S Shipley St
- 2013 S Shipley St
- 1811 E 13th St
- 1709 E 13th St
- 2015 S Shipley St
- 2013 S Brotherton St
- 1813 E 13th St
- 1707 E 13th St
- 2017 S Shipley St
- 2015 S Brotherton St