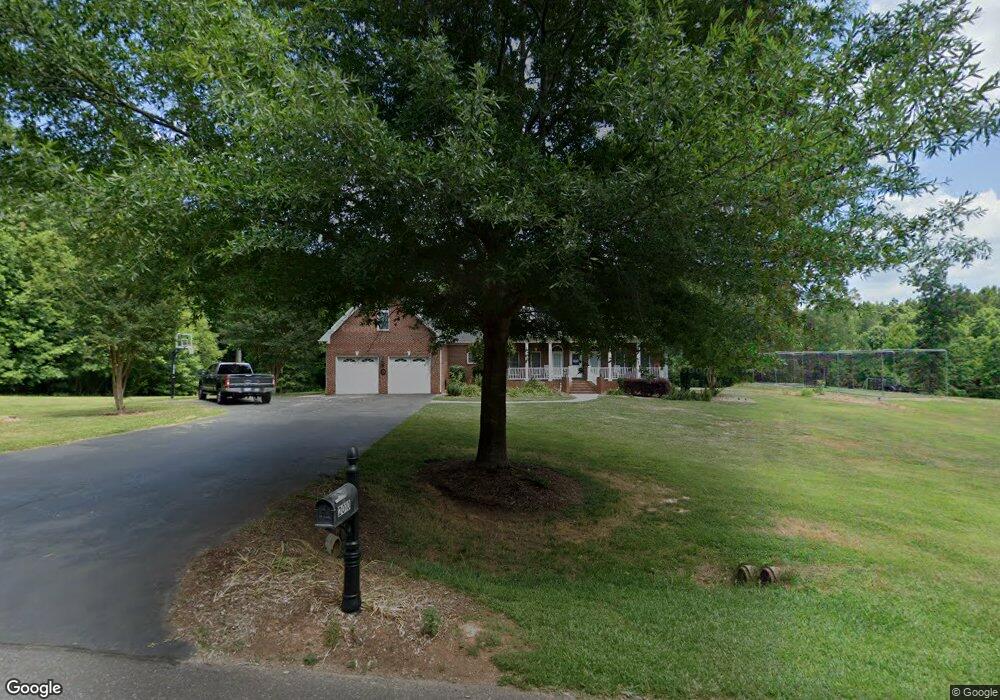
2010 Turning Oaks Trail Asheboro, NC 27205
Estimated Value: $532,000 - $664,355
4
Beds
3
Baths
3,100
Sq Ft
$188/Sq Ft
Est. Value
About This Home
This home is located at 2010 Turning Oaks Trail, Asheboro, NC 27205 and is currently estimated at $582,785, approximately $187 per square foot. 2010 Turning Oaks Trail is a home located in Randolph County with nearby schools including Sycamore Elementary School, Farmer Elementary School, and Uwharrie Ridge Six-Twelve.
Ownership History
Date
Name
Owned For
Owner Type
Purchase Details
Closed on
Oct 13, 2006
Sold by
Hall Wiecek Lisa Ann
Bought by
Armfield Robert Lee and Armfield Jamie Hughes
Current Estimated Value
Home Financials for this Owner
Home Financials are based on the most recent Mortgage that was taken out on this home.
Original Mortgage
$52,650
Interest Rate
6.36%
Mortgage Type
Purchase Money Mortgage
Purchase Details
Closed on
Feb 27, 2006
Sold by
Roberts W Vance and Roberts W
Bought by
Hall Wiecek Lisa Ann
Home Financials for this Owner
Home Financials are based on the most recent Mortgage that was taken out on this home.
Original Mortgage
$30,000
Interest Rate
6.08%
Mortgage Type
Seller Take Back
Create a Home Valuation Report for This Property
The Home Valuation Report is an in-depth analysis detailing your home's value as well as a comparison with similar homes in the area
Home Values in the Area
Average Home Value in this Area
Purchase History
| Date | Buyer | Sale Price | Title Company |
|---|---|---|---|
| Armfield Robert Lee | $58,500 | None Available | |
| Hall Wiecek Lisa Ann | $60,000 | None Available |
Source: Public Records
Mortgage History
| Date | Status | Borrower | Loan Amount |
|---|---|---|---|
| Closed | Armfield Robert Lee | $52,650 | |
| Previous Owner | Hall Wiecek Lisa Ann | $30,000 |
Source: Public Records
Tax History Compared to Growth
Tax History
| Year | Tax Paid | Tax Assessment Tax Assessment Total Assessment is a certain percentage of the fair market value that is determined by local assessors to be the total taxable value of land and additions on the property. | Land | Improvement |
|---|---|---|---|---|
| 2025 | $3,228 | $520,690 | $127,870 | $392,820 |
| 2024 | $3,228 | $520,690 | $127,870 | $392,820 |
| 2023 | $3,233 | $520,690 | $127,870 | $392,820 |
| 2022 | $2,657 | $352,270 | $75,760 | $276,510 |
| 2021 | $2,558 | $352,270 | $75,760 | $276,510 |
| 2020 | $2,553 | $351,630 | $75,760 | $275,870 |
| 2019 | $2,552 | $351,630 | $75,760 | $275,870 |
| 2018 | $2,362 | $317,660 | $68,310 | $249,350 |
| 2016 | $2,362 | $317,656 | $68,310 | $249,346 |
| 2015 | $2,332 | $317,656 | $68,310 | $249,346 |
| 2014 | $2,332 | $317,656 | $68,310 | $249,346 |
Source: Public Records
Map
Nearby Homes
- 0 Tot Hill Farm Rd
- 1746 Taylors Creek Dr
- 3526 Tot Hill Farm Rd
- 0 Deer Ridge Rd Unit 1190677
- 0 Deer Ridge Rd Unit 1191444
- 2579 Grey Rabbit Run
- 2318 Doul Mountain Rd
- 2442 Farmwood Ln
- 2272 Doul Mountain Rd
- Lot 12 Johns Ridge Dr
- Lot 13 Johns Ridge Dr
- 0 Fox Ridge Rd Unit 1197775
- Lot 37 Fox Ridge Rd
- 2634 Fox Ridge Rd
- 2613 High Meadow Dr
- 2626 Fox Ridge Rd
- 2565 High Meadow Dr
- 1559 Allen Ct
- 001 High Meadow Dr
- Lot 24 Maple Hill Ct
- 2045 Turning Oaks Trail
- 2052 Turning Oaks Trail
- 1953 Turning Oaks Trail
- 2063 Turning Oaks Trail
- 3170 Nc Highway 49 S
- 3554 Nc Highway 49 S
- 3167 Nc Highway 49 S
- 2995 Shaw St
- 2997 Shaw St
- 2905 Shaw St
- 2949 Shaw St
- 3073 Creekridge Dr
- 2988 Shaw St
- 3089 Creekridge Dr
- 2919 Shaw St
- 3053 Creekridge Dr
- 3730 Tot Hill Farm Rd
- 3133 Nc Highway 49 S
- 2964 Shaw St
- 2981 Creekridge Dr