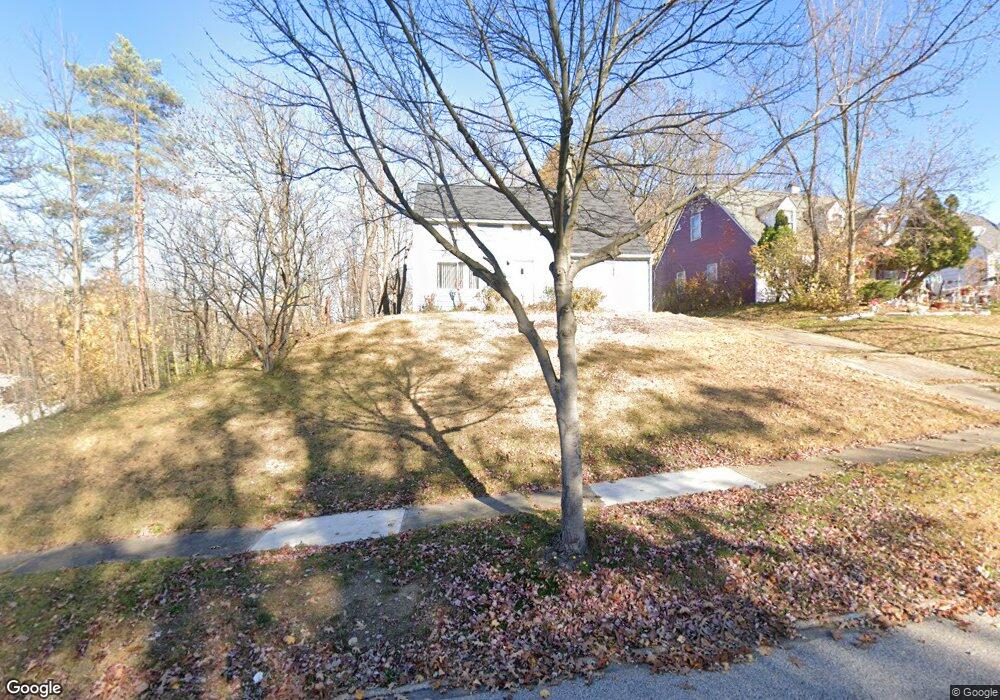
20103 Butternut Ln Cleveland, OH 44128
Estimated Value: $116,885 - $138,000
4
Beds
2
Baths
1,152
Sq Ft
$109/Sq Ft
Est. Value
About This Home
This home is located at 20103 Butternut Ln, Cleveland, OH 44128 and is currently estimated at $125,971, approximately $109 per square foot. 20103 Butternut Ln is a home located in Cuyahoga County with nearby schools including John Dewey Elementary School, Warrensville Heights Middle School, and Warrensville Heights High School.
Ownership History
Date
Name
Owned For
Owner Type
Purchase Details
Closed on
Dec 22, 2022
Sold by
Thompson Teresa and Thompson David L
Bought by
Jd Blanks Llc
Current Estimated Value
Purchase Details
Closed on
Aug 11, 2016
Sold by
Walton Robert
Bought by
Thompson Teresa
Purchase Details
Closed on
Nov 23, 1998
Sold by
Ingram Roderick L and Ingram Angela D
Bought by
Walton Robert
Home Financials for this Owner
Home Financials are based on the most recent Mortgage that was taken out on this home.
Original Mortgage
$57,288
Interest Rate
6.59%
Mortgage Type
FHA
Purchase Details
Closed on
Apr 26, 1991
Sold by
Stoltzfus Arthur R
Bought by
Ingram Roderick L
Purchase Details
Closed on
Apr 27, 1989
Sold by
Shands Joyce E
Bought by
Brown Joyce E
Purchase Details
Closed on
Jun 8, 1981
Sold by
Mckinney Edwina J
Bought by
Shands Joyce E
Purchase Details
Closed on
Jan 1, 1975
Bought by
Mckinney Edwina J
Create a Home Valuation Report for This Property
The Home Valuation Report is an in-depth analysis detailing your home's value as well as a comparison with similar homes in the area
Home Values in the Area
Average Home Value in this Area
Purchase History
| Date | Buyer | Sale Price | Title Company |
|---|---|---|---|
| Jd Blanks Llc | -- | None Listed On Document | |
| Thompson Teresa | $17,100 | None Available | |
| Walton Robert | $57,000 | Affiliated Title | |
| Ingram Roderick L | $47,500 | -- | |
| Brown Joyce E | -- | -- | |
| Stoltzfus Arthur R | $25,000 | -- | |
| Shands Joyce E | $37,000 | -- | |
| Mckinney Edwina J | -- | -- |
Source: Public Records
Mortgage History
| Date | Status | Borrower | Loan Amount |
|---|---|---|---|
| Previous Owner | Walton Robert | $57,288 |
Source: Public Records
Tax History Compared to Growth
Tax History
| Year | Tax Paid | Tax Assessment Tax Assessment Total Assessment is a certain percentage of the fair market value that is determined by local assessors to be the total taxable value of land and additions on the property. | Land | Improvement |
|---|---|---|---|---|
| 2024 | $2,262 | $33,250 | $10,535 | $22,715 |
| 2023 | $1,850 | $19,920 | $6,480 | $13,440 |
| 2022 | $1,783 | $19,920 | $6,480 | $13,440 |
| 2021 | $1,756 | $19,920 | $6,480 | $13,440 |
| 2020 | $2,597 | $17,010 | $5,530 | $11,480 |
| 2019 | $1,676 | $48,600 | $15,800 | $32,800 |
| 2018 | $1,779 | $17,010 | $5,530 | $11,480 |
| 2017 | $2,000 | $19,290 | $5,710 | $13,580 |
| 2016 | $1,884 | $19,290 | $5,710 | $13,580 |
| 2015 | $4,576 | $19,290 | $5,710 | $13,580 |
| 2014 | $2,253 | $22,440 | $6,620 | $15,820 |
Source: Public Records
Map
Nearby Homes
- 20117 Butternut Ln
- 20211 Longbrook Rd
- 19602 Cherrywood Ln
- 19502 Hathaway Ln
- 19400 Mayfair Ln
- 4043 Township Pkwy
- 19201 Hathaway Ln
- 4146 Ascot Ln
- 19819 Harvard Ave
- 19615 Harvard Ave
- 4288 Larkspur Ln
- 4217 E 189th St
- 20715 E Ridgewood Ave
- 20614 Kings Hwy
- Addley Plan at Lakes of Orange - The Townhomes Series
- Branton Plan at Lakes of Orange - The Townhomes Series
- 19207 Harvard Ave
- 19708 Sunset Dr
- 4234 E 187th St
- 3905 Warrensville Center Rd
- 20107 Butternut Ln
- 20015 Butternut Ln
- 20113 Butternut Ln
- 20009 Butternut Ln
- 20201 Butternut Ln
- 20005 Butternut Ln
- 20205 Butternut Ln
- 4248 Hickory Ln
- 4249 Cricket Ln
- 4236 Cricket Ln
- 20209 Butternut Ln
- 4253 Cricket Ln
- 4254 Hickory Ln
- 20206 Butternut Ln
- 4238 Cricket Ln
- 4257 Cricket Ln
- 20213 Butternut Ln
- 4242 Cricket Ln
- 4258 Hickory Ln
- 4249 Hickory Ln